


In the dynamic world of commodities, the narrative surrounding gold’s performance is always of keen interest to investors and market watchers. Recently, there has been a notable shift in the trajectory of gold prices that warrants a closer examination. Just a few days past, conjectures were being made about June potentially being a month of decline for gold; these predictions have swiftly materialized into reality.
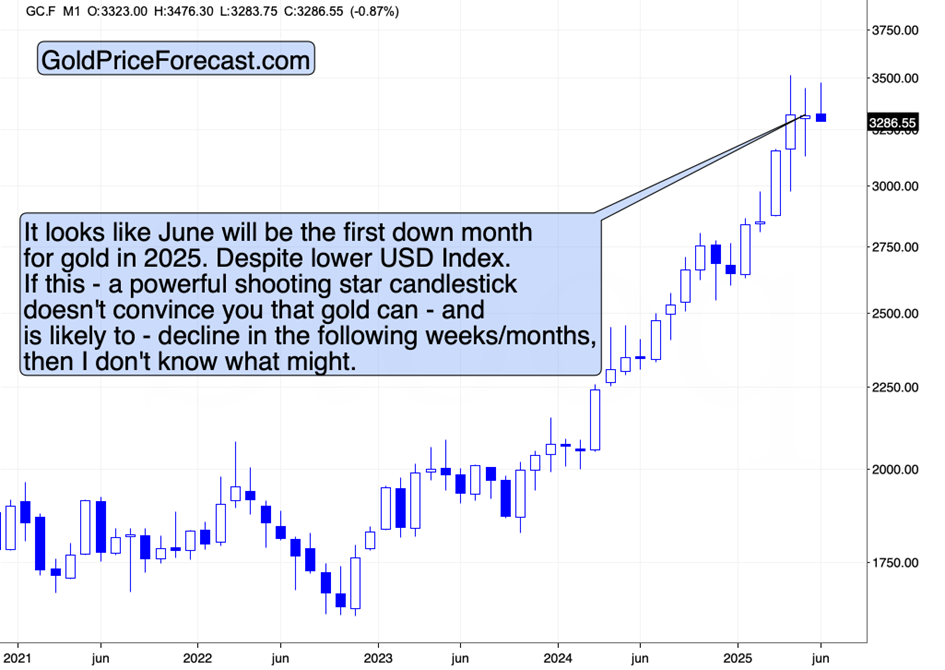
As things currently stand, gold has experienced a significant drop, retreating by almost 1% during this month. This downturn, while not alarmingly large, assumes significance as it positions June (bearing in mind we still have a couple of days left in the month) to potentially mark the first monthly decline for gold in the year 2025. Leading up to this point, gold had been on a remarkable rally, with prices surging consistently until April. However, the momentum seems to have taken a downturn thereafter.
The intricacies of market mechanics have somewhat shielded gold from a more drastic collapse. However, even a break to new yearly lows in the dollar hasn’t staved off the precious metal’s decline or the possible formation of a potent monthly shooting star – a candlestick pattern often interpreted as a reversal signal.
Upon closer inspection, particularly through a daily timeframe analysis, it becomes unmistakable that gold has indeed breached crucial support lines. In essence, not one, but two ascending support lines have been conclusively broken, providing a stark confirmation that the upward trend gold has enjoyed is conclusively over, making way for a potential downtrend.
Further examination extends to silver, which mirrors the declining trend, pointing towards a likely scenario of intensified selling once prices dip below the lows set in 2024. This development comes on the back of noteworthy movements where silver, following significant highs, exhibited intraday reversals, aligning precisely with occurrences observed right after previous major peaks. This pattern offers a short-term sell signal, characterized by silver’s short-term outperformance of gold, despite miners not exhibiting similar trends. For traders contemplating increasing their short positions in silver, this setup suggests a compelling risk-to-reward opportunity, underscored by silver’s recent approximate 2% decline.
Turning our gaze towards the USD Index, an essential barometer for gauging the greenback’s strength against a basket of currencies, we find ourselves on the cusp of a critical juncture. The anticipation of the USD Index rallying, as alluded to in strategies resembling those outlined in Trump’s “Art of the USD,” hints at a forthcoming acceleration in gold and silver declines. This movement aligns with the cycle of the USD Index, which appears to be nearing a pivotal turning point. The implications of this turn, especially following a period of decline, are predominantly bullish for the dollar.
This narrative around gold, silver, and the broader financial indicators underlines the interconnectedness of various assets and the significant influence of currency strength on commodity prices. For investors and observers alike, these developments serve as a crucial reminder of the volatility and complexity inherent in global financial markets. The unfolding scenario encapsulates the oscillations between bullish and bearish sentiments, driven by macroeconomic indicators, speculative trading, and strategic positioning by investors looking to navigate the ever-changing tides of the commodities market. As we inch closer to the end of June, all eyes will remain fixated on how these dynamics continue to evolve, shaping the trajectory of precious metals in the weeks and months to come.


