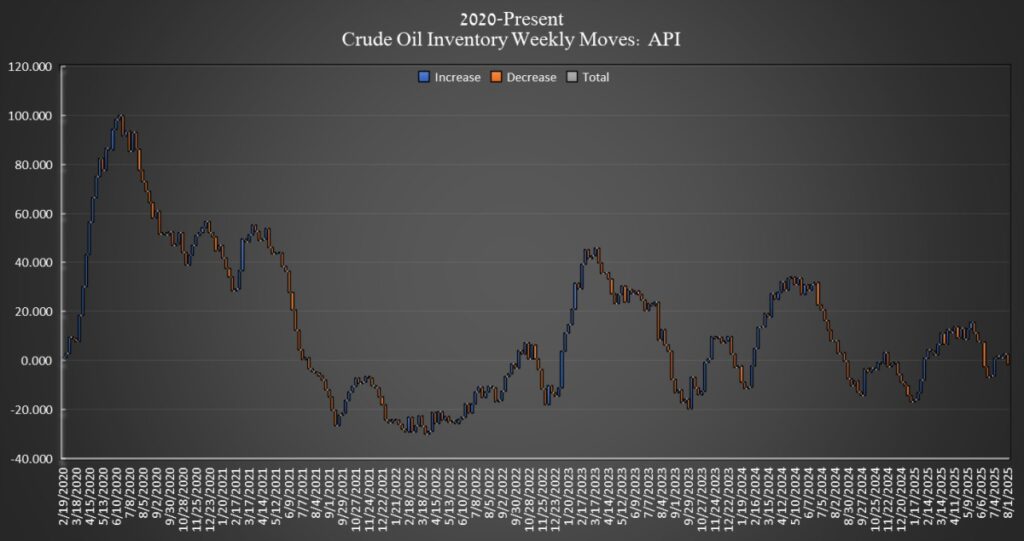
In the ever-evolving landscape of the global energy market, a recent report by the American Petroleum Institute (API) has thrown spotlight on the United States’ oil inventory dynamics, depicting a significant dip that may reverberate through the markets. For the week ending on the 1st of August, an unexpected decline in oil reserves was recorded, with figures showing a decrease of 4.2 million barrels. This figure starkly contrasted with the forecasts of analysts, who anticipated a modest drawdown of 1.8 million barrels.
To understand the broader context of this surprising shift, it’s essential to glance at the year’s trajectory. According to calculations derived from API data by Oilprice, the cumulative crude oil inventories for the year have witnessed an upward movement, nearly reaching an additional 9 million barrels. This gradual accumulation underscores the volatility and the multitude of factors influencing the oil markets.
Another key player in the scenario is the Department of Energy (DoE) of the United States, which provided insights into the status of the Strategic Petroleum Reserve (SPR). Within the same timeline, the SPR saw an increment by 300,000 barrels, pushing the total to 403 million barrels. It’s noteworthy to mention that these strategic reserves have experienced significant depletion, especially in the aftermath of initiatives by the Biden Administration starting in 2022 aimed at stabilizing the market and prices. The current levels, although recuperating, are markedly lower than the figures preceding these large-scale withdrawals.
How these shifts impact market prices is a complex interplay of expectations, realities, and investor sentiment. Moments before the API’s data release, the trading landscape mirrored the anticipatory tension. The benchmark West Texas Intermediate (WTI) crude was down by $1.20 (-1.81%), settling at $65.09, which is a notable decline of over $4 compared to the figures from the previous week. This dip came on the heels of OPEC’s decision to relax its production quotas, a move that has consequential reverberations in pricing dynamics globally.
Beyond crude, the intricacies of the market extend to refined products like gasoline and distillates, each with its unique pattern of demand and supply. The API report shed light on gasoline inventories, which saw a reduction of 900,000 barrels in the week ending August 1, following a more substantial drop the week before. This movement positions gasoline stocks at 1% below the five-year average for this season, as per the latest data from the Energy Information Administration (EIA).
Conversely, distillate inventories, encompassing diesel and heating oil, traced an upward trajectory, increasing by 1.6 million barrels. This comes after a considerable increment the previous week, outlining a consistent rise. However, even with this ascent, distillate stocks are 16% beneath the five-year average, suggesting a tighter market that could influence prices and availability.
A focal point in the U.S. oil landscape is Cushing, Oklahoma, a critical hub for trading and storage, where shifts can serve as a barometer for broader trends. The recent API report indicates a rise in Cushing’s crude inventories by 1.7 million barrels in the week, a significant addition compared to the increment observed in the preceding week.
This detailed excursion through the latest developments in the United States’ oil inventories unveils several layers of the global energy market’s complexity. These movements, punctuated by unexpected fluctuations, not only affect pricing and investor strategies but also have broader implications for energy security, policy-making, and the transition to sustainable energy sources.
As we navigate through these turbulent waters, the role of strategic reserves like the SPR, the decisions of influential bodies like OPEC, and the evolving demand for oil and its derivatives remain pivotal. The delicate balance between supply, demand, and external factors such as geopolitical tensions and environmental considerations continues to shape the future of energy, with each week’s data adding a new chapter to this unfolding narrative.


