


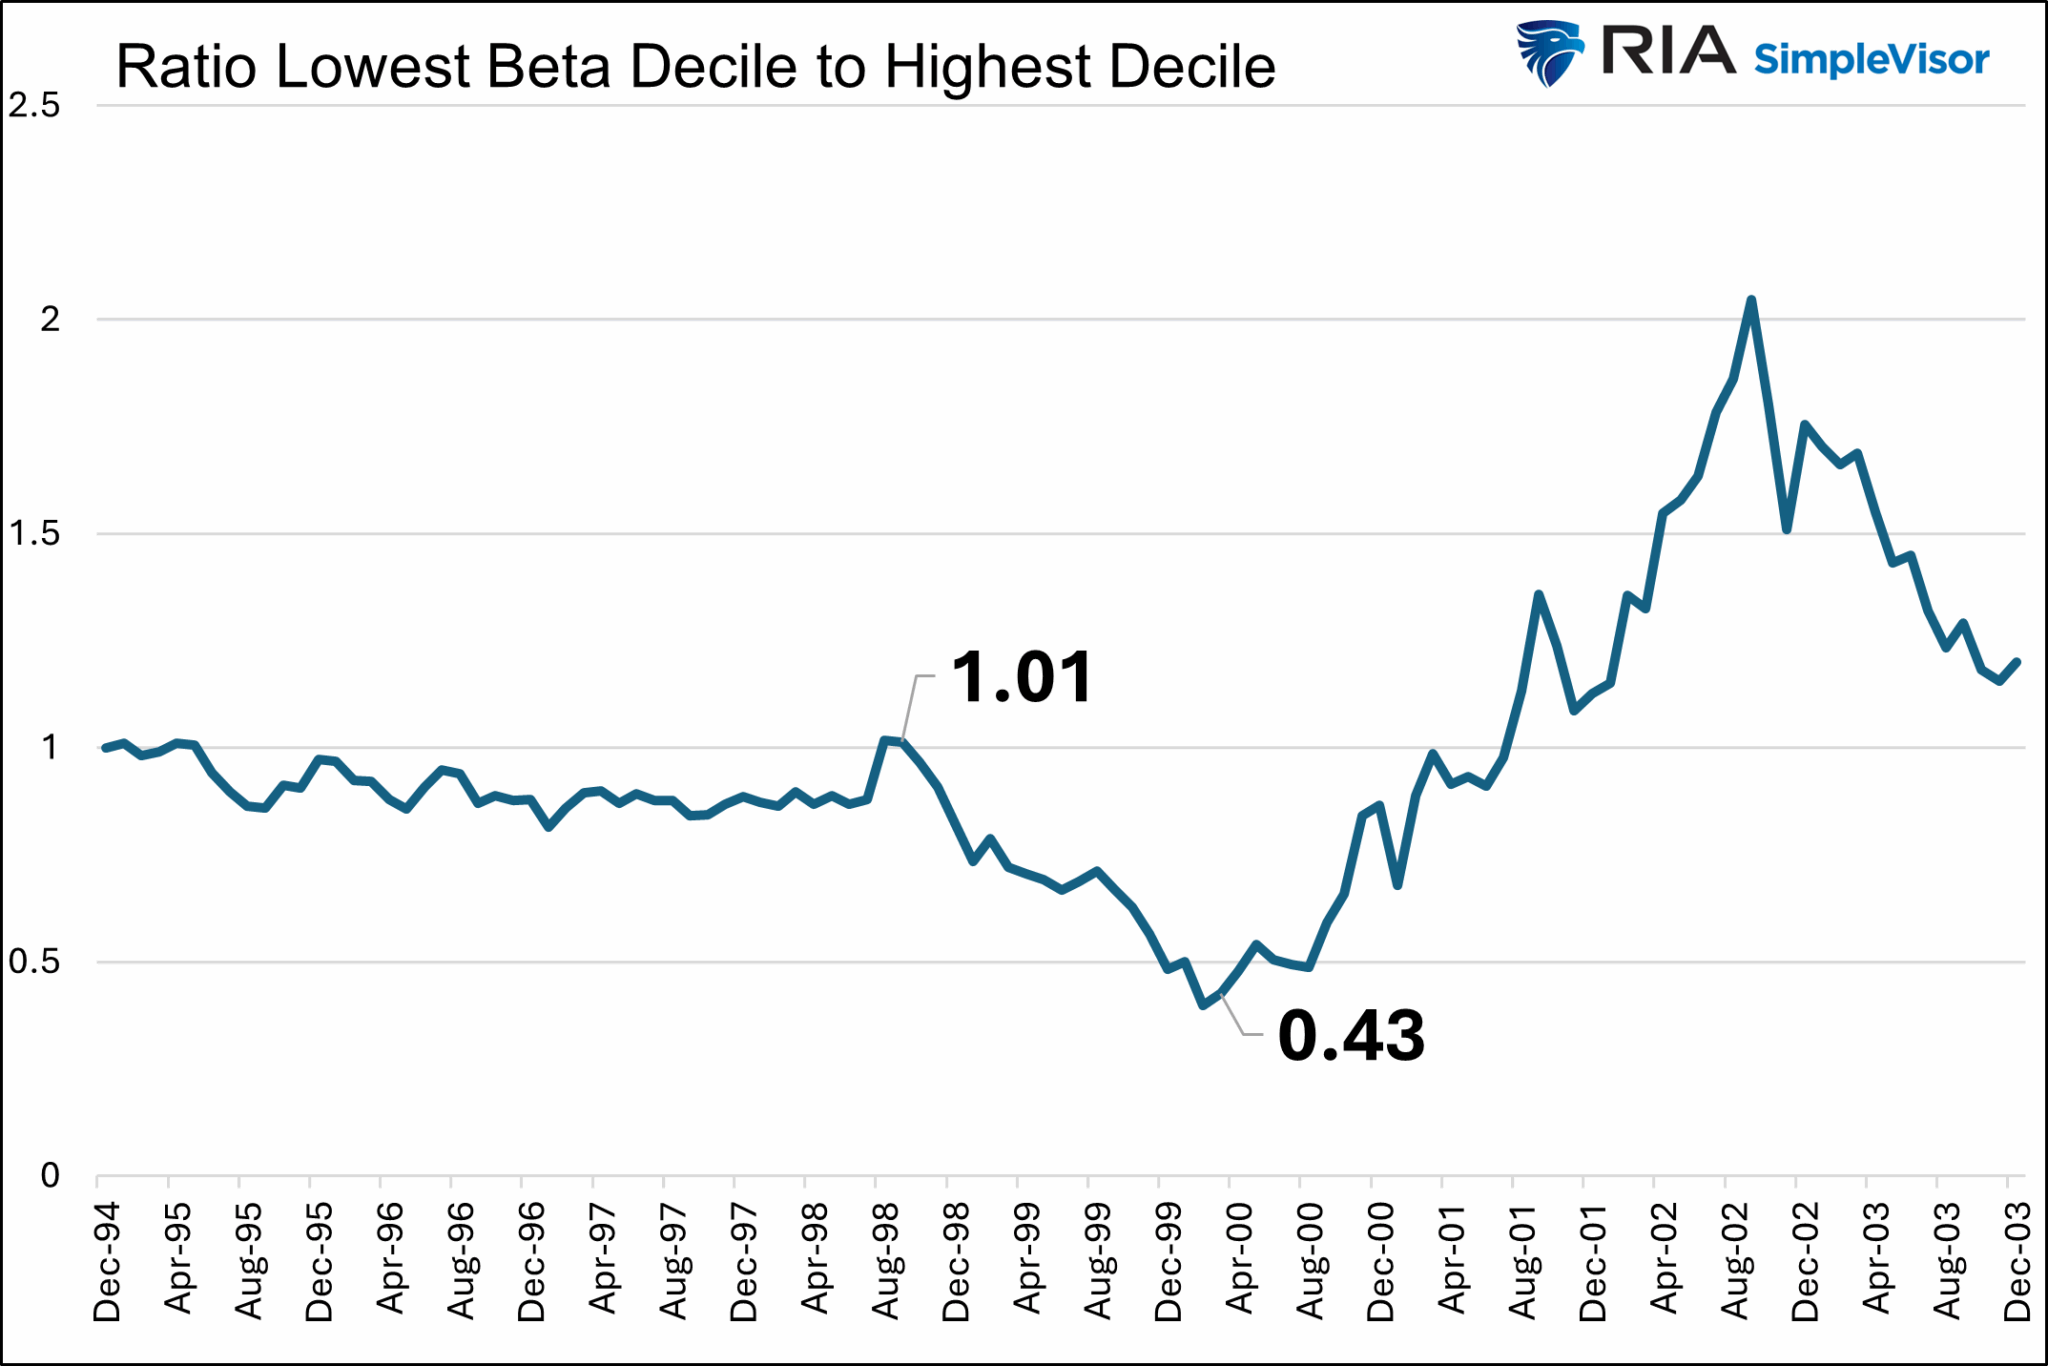
In the wake of publishing our initial article, we’ve received several communications expressing concern that our readers were left in suspense. They were curious as to how investors could have adeptly manoeuvred their investments from volatile, high beta, and momentum-driven stocks to evade significant financial setbacks during the collapse of the dot-com bubble. While our earlier piece highlighted that low beta stocks demonstrated resilience during the downturn, we overlooked fleshing out the specifics.
Diving into the intricacies, the transition from high to low beta stocks at the twilight of the dot-com bubble in 2000 emerges as a sage move. This is substantiated by a graph in the original article, shedding light on the fact. Moreover, a secondary graph provides a broader perspective, showing that although low beta stocks averaged flat returns during the 1998-2000 boom, their performance over the entire boom-bust cycle (1998-2003) boasted a +35% return. On the flip side, the highest beta stocks, despite surging by 111% during the boom, only registered a modest 2% return over the full period.
Managing a diverse portfolio parallels the role of a sports team coach, who must continuously evaluate the game, deciding which players to field and when to substitute them, adapting to the game’s evolving dynamics.
Extending this analogy to the investment realm, it’s crucial to invest in a manner that aligns with the current market conditions while also preparing for future shifts. Thus, this discussion moves beyond mere high and low-beta stocks to examine how various stock factors fared during the dot-com boom-bust era, offering insights into the types of stocks that may thrive in the event of a market downturn akin to that era.
The analysis leverages monthly decile data from Kenneth French of Dartmouth, comprising all stocks traded on major exchanges like NYSE, NASDAQ, and AMEX, spanning the 1995-2003 market cycle.
An examination of growth versus value stocks reveals nuanced dynamics. For growth and value stock differentiation, the traditional price-to-book value ratio is employed, albeit with French’s data calculating this ratio inversely, hence price to book. This analysis indicates a preference for growth stocks over value stocks leading up to and during the 1998-2000 boom. Yet, it’s noteworthy that the utmost decile of value stocks outperformed lower deciles significantly.
The ensuing graph illustrates the performance disparity between growth (lowest decile) and value (highest decile) stocks throughout the entire cycle, with value stocks distinctly outshining their growth counterparts outside the 1998-2000 melt-up. Moreover, a conclusive chart demonstrates that, despite underperformance during the boom, investors who steadfastly adhered to value stocks throughout the cycle reaped superior gains compared to those favoring growth stocks.
Next, the article delves into market capitalization’s influence during the dot-com era, discerning a marked variation in performance across different market cap deciles before, during, and post the bubble. In the lead-up to the 1998 melt-up, sizable disparities were evident, with the largest-cap stocks significantly outpacing smaller-cap ones. Nevertheless, the lowest market cap deciles emerged as frontrunners during the boom and sustained growth through the bust and recovery phases, highlighting the potential for achieving greater returns by pivoting towards smaller companies in anticipation of future market corrections.
Furthermore, the discussion incorporates profitability as a key theme, elucidating how stocks with minimal to no profits have recently garnered impressive gains, echoing trends from the 1998-2000 boom driven by companies with poor profitability metrics. The analysis reveals that during the 1995-2003 market cycle, the least profitable decile severely underperformed against the most profitable stocks. This distinction was even more pronounced during the boom, underscoring the potential risks and rewards associated with investing in high-growth, low-profitability enterprises.
In synthesizing these findings, the narrative draws parallels between investor behavior during the dot-com boom-bust and current market trends, noting the historical preference for larger, more profitable companies prior to market corrections and a shift towards high beta, low profitability stocks amid speculative fervor. This historical context suggests the importance of diversifying portfolios with smaller, low-beta, value-focused, and highly profitable stocks to mitigate risks and capitalize on potential market downturns.
In summary, the nuanced exploration of investment dynamics during the dot-com era and its relevance to contemporary market conditions underscores the need for strategic portfolio management to navigate speculative bubbles and subsequent market adjustments. By drawing on historical patterns and performance metrics across various stock factors, investors can better position themselves to weather future market fluctuations and cultivate wealth sustainably.

