


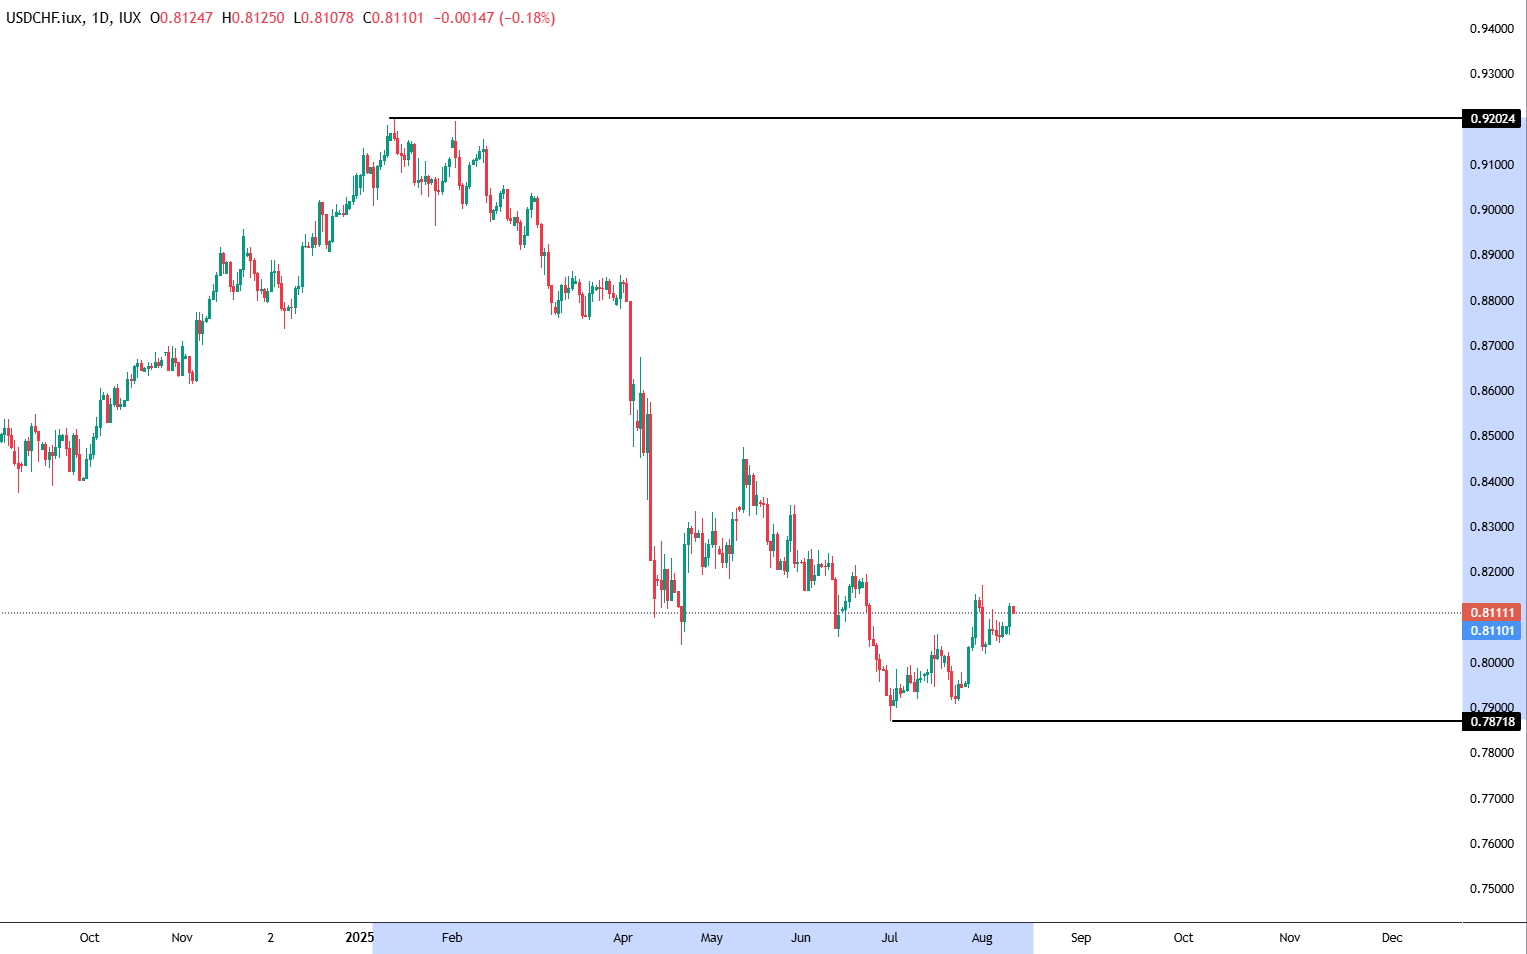
When examining the fluctuations in the market over an extended duration, it becomes apparent that there has been a notable downward trend that traces its origins back to the start of January. This period has witnessed the market consistently breaching support levels and registering lower troughs. Specifically, the downtrend encompasses a significant movement from 0.92024 down to 0.78718, corresponding to a descent exceeding 1,300 pips.
In the realm of economic indicators and their impact on market trajectories, the Consumer Price Index (CPI) from the United States emerges as a pivotal metric. Slated for release on August 12, 2025, this indicator is poised to offer insights into inflation dynamics during July of the same year. Such metrics hold the potential to shape the Federal Reserve’s policy outlook, particularly in terms of adjusting interest rates to manage inflation efficiently. The anticipatory consensus among economists suggests a moderate inflation increase of approximately 0.2% month-over-month (translating to an estimated 2.8% year-over-year), while the core CPI (excluding food and energy prices) is expected to exhibit a rise of about 0.3% month-over-month, or roughly 3.0–3.1% on an annual basis.
The reaction to this anticipated CPI report can unfold across three possible scenarios, each carrying distinct implications for the market:
-
Alignment with Expectations: Should the CPI data align with prior expectations, the market reaction might be muted owing to the forecast already being factored into current prices. This could result in limited price movements, with market dynamics likely continuing along their preceding trend lines. Such an outcome would also see a tempered volatility in stocks and commodities, as traders pivot their attention towards forthcoming economic catalysts such as FOMC minutes or employment data. The overarching global market sentiment would remain steady, with minor shifts, if any, in the Federal Reserve’s policy outlook.
-
CPI Figures Exceed Expectations: An unexpectedly high CPI measurement could signal enduring inflation pressures, potentially leading to a recalibration of expectations regarding the Federal Reserve’s interest rate policies. A stronger than anticipated inflation reading might dampen hopes for imminent rate cuts, or even foster speculation around further rate hikes. This scenario would likely bolster the US dollar, reflecting heightened anticipations for a “higher-for-longer” interest rate environment. Conversely, such a development could exert pressure on rate-sensitive sectors like technology and growth-oriented industries, while possibly offering a slight advantage to the financial sector. Precious metals, such as gold and silver, might experience a decline due to the increased opportunity cost of holding such non-yielding assets. For emerging markets, a robust US dollar could heighten challenges by augmenting the burden of USD-denominated debt.
-
CPI Figures Fall Below Expectations: A cooler than forecasted CPI reading would hint at a quicker than anticipated cooling of inflation, potentially prompting the Federal Reserve to consider earlier rate cuts, including at its subsequent meeting. This scenario would likely result in a weakening of the US dollar as yield expectations are adjusted downwards. A dovish shift could lead to a decline in yields, particularly for shorter-term securities. Equity markets might enter a ‘risk-on’ phase, with growth stocks and sectors sensitive to interest rates gaining momentum. In such an environment, commodities like gold could witness gains as real yields drop. A weaker US dollar would also alleviate pressure on emerging markets, potentially encouraging capital inflows.
Further to the fundamental analysis, technical indicators on the H4 timeframe reveal that the market has penetrated previous resistance levels, suggesting a potential for continued upward movement towards the next resistance zone. The adoption of the EMA 50 and MACD indicators highlights a prevailing uptrend, evidenced by the market’s position above the EMA and a positive MACD histogram. These technical analysis tools suggest an established upward momentum, awaiting confirmation from upcoming economic news which could further influence the currency’s trajectory.
In terms of trading strategies for USD/JPY, discerning traders might consider the following zones:
-
Support Zone: Key levels to watch include a long-term support range spanning 0.78859 to 0.78645, alongside a medium-term support zone marked by 0.80686 to 0.80406.
-
Resistance Zone: Traders should take note of a long-term resistance corridor between 0.84487 and 0.84750, in addition to a medium-term resistance area delineated by 0.81986 to 0.81772.
This comprehensive analysis underscores the intertwined nature of fundamental and technical factors in shaping market dynamics. As we edge closer to the release of crucial economic data, the market stands at a crossroads, with potential pathways influenced by a myriad of factors, from inflationary pressures to Federal Reserve policies. Investors and traders alike are advised to stay attuned to upcoming developments, ready to adapt their strategies to the evolving economic landscape.


