


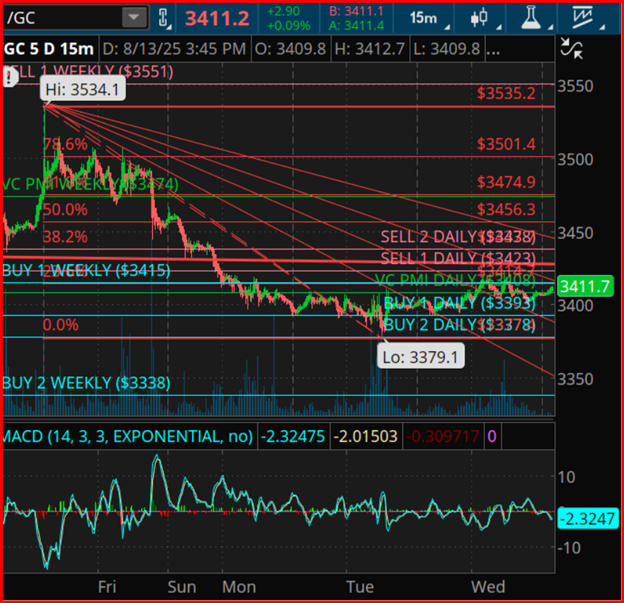
As of now, the price of gold stands at an intriguing junction, marked at $3,411.2. This comes after a slight descent from its August 7 apex, where it reached heights of $3,534.1. Currently, the trading dynamics of gold are tightly wedged between two critical points: the Weekly Buy 1 position at $3,415, and the Daily Pivot resting at $3,408. This positioning has forged a zone distinguished by its low volatility, a precursor phase that often preludes to high-probability breakthroughs in the market. This phenomenon, where price alignment, temporal factors, and cyclical structures intersect, is frequently indicative of a near future that holds heightened volatility.
Diving deeper into the anatomy of the current market configuration, the price of gold is underpinned and capped by a series of vital support and resistance levels. At the support end, there are two notable markers: the Daily Buy 2 positioned at $3,378, and the Weekly Buy 2 at $3,338, the latter being underscored by a recent low of $3,379.1. On the flip side, the resistance layer is established by the Daily Sell 1 and Daily Sell 2 at $3,423 and $3,438 respectively, along with the Weekly Pivot hovering around $3,474. The resistance band stretching from $3,423 to $3,438 is particularly compelling as it represents a zone of price compression that lies just beneath significant fib retracement levels, alongside coinciding with the Weekly Pivot.
To further understand these movements, the Gann Time Cycles provide a fascinating lens. Originating from the peak on August 7 (denoted as T = 0), the progression unfolds through several critical phases: a 45° time rotation marking the first hint at trend changes, a 90° rotation representing a stronger likelihood of reversal, and a 180° rotation that opens a window for a medium-term pivot in market direction. Currently, we find ourselves within the first cluster of this Gann sequence, a period where even the slightest news triggers have the potential to catalyze significant market shifts.
Additionally, the Gann Square of 9 offers predictive insight into potential price movements. From the vantage point of the $3,534.1 high, subsequent rotations forecast various levels of support and resistance, leading up to a full 360° rotation that aligns seamlessly with major support zones and historical lows.
Overlaying this with the 360-Day Cycle illustrates an annual rhythmic wave anticipated to crest in September 2025, based on analyses from the major lows in 2024. This pattern suggests that the lead-up to this peak might exhibit either a formidable breakout or a deep retracement, laying the groundwork for the seasonal push in September. Historically, gold has shown a tendency to pivot lower roughly 20–30 days prior to reaching this seasonal zenith, highlighting the current timeframe as a statistically significant window for observing market lows.
Integrating insights from VC PMI pivots, Gann time cycles, Square of 9 price harmonics, and the 360-day seasonal model reveals a striking alignment across various dimensions. This confluence underscores a support zone ranging from $3,378 to $3,338, juxtaposed with a resistance zone between $3,423 to $3,474. The temporal alignment converges around mid-August, earmarking this period as critical for the anticipation of directional market movements.
The trading implications of this setup are multifaceted. In a bullish scenario, holding above $3,408 and breaching the $3,423–$3,438 resistance could pave the way toward targets set at $3,456, $3,474, and potentially extending up to $3,501–$3,535. Optimal times for these movements are projected around mid-August. Conversely, a bearish outcome would see a dip below $3,378, closely targeting the $3,338 level before potentially stabilizing in anticipation of a September rally. This predicament places a heightened emphasis on the imminent days outlined by the Aug 13–16 cycle window, rendering a “wait and see” approach riskier than usual for trend traders.
It is crucial to recognize that trading derivatives, financial instruments, and precious metals carries significant risks and is not universally suitable. Historical performances, while informative, do not guarantee future results. This comprehensive analysis provides a snapshot of the intricate dance between gold’s price movements and the cyclical forces at play, equipping traders and market watchers with a deeper understanding of the potential shifts on the horizon.


