In the swirling world of finance and commodities, the unfolding saga of gold trading over the past week has been a textbook example of the dynamic push-and-pull between bulls and bears, underpinned by a symphony of technical analysis and arcane mathematical principles. For those not well-versed in the intricate dance of the markets, the recent price movements of gold represent not just fluctuations in value, but a narrative rich with strategic implications and mathematical significance.
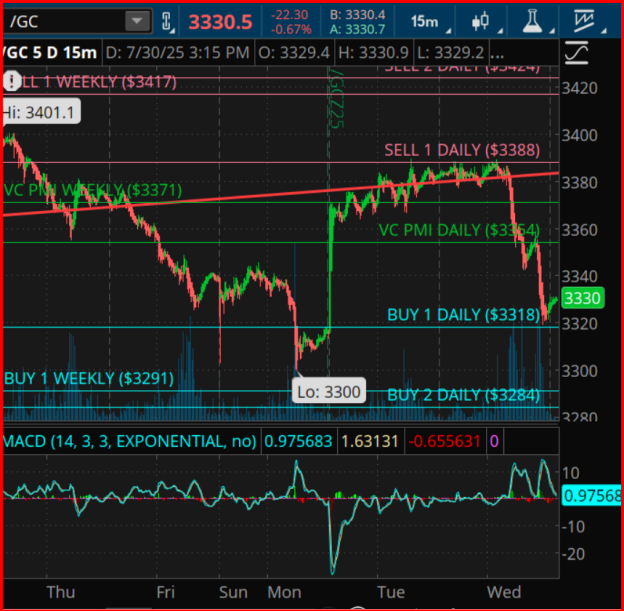
At the outset of the week, the marketplace experienced a turbulent downturn that culminated in gold’s valuation touching a noteworthy nadir of $3300 on Monday. This decline was not merely a random blip; rather, it was a moment of intense speculation and analysis for traders, who saw it as a pivotal inflection point largely due to its alignment with several historical and mathematical frameworks known for their predictive power.
Delving deeper, this significant trough was the product of a confluence of factors, including the Weekly Buy 1 and Daily Buy 2 levels at $3291 and $3284, respectively. These figures are not arbitrary but are rooted in the venerable Square of 9 theory—a concept attributed to the legendary trader William Delbert Gann. This principle, alongside Gann’s broader work, suggests a universe where market movements adhere to geometric and numerological patterns. According to this perspective, Monday’s low represented a 360° Square of 9 rotation from a recent peak price of $3401, epitomising a mathematically symmetrical retracement to $3290.
However, the narrative did not stall at this bottom, for gold swiftly undertook a rebound, propelling itself toward a mean reversion rally indicative of the market’s ever-present tension between correction and recovery. The ascent aimed for the VC PMI Weekly high of $3371 and danced around the Sell 1 Daily level at $3388, before encountering formidable resistance which checked its progress and directed it back into a descent.
As the week progressed, Wednesday’s session witnessed yet another retest, this time of the $3318 Daily Buy 1 level, marking a southward pullback within a Textbook Gann 2-day cycle—a phenomenon suggesting an imminent reversal potentially as early as Thursday, July 31. This date coincides neatly with a 3-day Gann pivot cycle emanating from Monday’s low, offering a glimmer of hope for a bullish resurgence.
From a technical standpoint, the MACD (Moving Average Convergence Divergence) indicator affirmed a prevailing downside momentum, yet the emergence of a subtle bullish divergence hinted at a weakening of seller control, particularly around significant geometric support levels.
Understanding the broader implications of these movements requires an immersion into the key takeaways distilled from the week’s activity:
– The $3300 low marked on Monday stands as a critical juncture within the Gann/Square of 9 cyclical framework, denoting a potentially pivotal baseline for future movement.
– A defined Support Zone between $3284 and $3291, embodying a melding of Weekly VC PMI, Daily Buy 2, and the mathematical elegance of a 360° Square of 9 rotation, underpins the market’s current stance.
– Resistance, notably within the $3354 to $3388 bracket, delineates the hurdle that gold faces in its attempt to reconvene a bullish ascent.
– A specific Time Window converges on Thursday, highlighted as the next potential Gann reversal window, which could herald a bullish setup should the prevalent support maintain its ground.
Encircled within a high-probability mean reversion zone, gold’s current posture is one of poised readiness, with geometric support and cyclical time sequences indicating a ripe potential for an upward trajectory. A decisive close above $3354 could catalyse a sprint to higher grounds, while a failure to safeguard the $3284 level might precipitate a descent towards the $3250 Square of 9 extension.
To navigate the convoluted landscape of gold trading, observers and participants alike must grapple with a delicate balance of technical analysis, historical patterns, and the enigmatic influence of time-tested principles like those of Gann and the Square of 9. As the narrative unfolds, the interplay of these factors will continue to shape the fortunes of gold, offering a compelling lesson in the complexities of commodity markets and the timeless quest to decipher their future paths.


