Analyzing Energy Market Trends: A Comprehensive Review from 2010 to the Present
The landscape of energy markets is intricate and perpetually changing, influenced by an array of factors including geopolitical events, technological advancements, and most notably, the shifting patterns of supply and demand. Over the past decade and a half, the energy sector has witnessed significant fluctuations. This article endeavors to unravel these complex dynamics, offering a deep dive into key metrics that underline the current state of the energy market as compared to historical data, spanning from 2010 to the present day.
Price Dynamics: A Historical Comparison
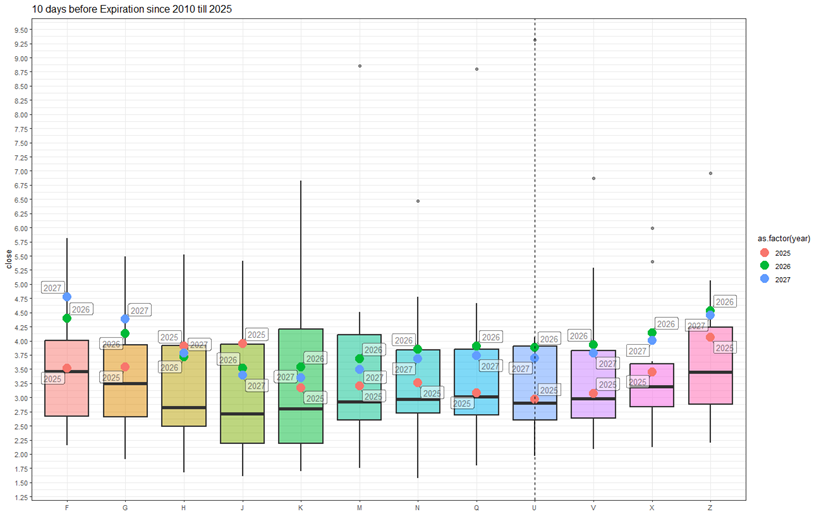
A critical aspect of understanding market trends involves examining the evolution of price points. The ‘Contract U’, a terminological marker within the energy sector, notably stands as a testament to such evolving dynamics. It is observed to be trading at a level consistent with the average price observed 10 days prior to the expiration of all expired contracts over the previous 15 years. This stability in pricing juxtaposition reveals a pattern of relative market equilibrium over the long term.
Delving deeper into future contracts, we note a more nuanced delineation occurring within the Fall 2025 contracts. These contracts are trading closer to the median values historically noted on their expiration date, yet they intriguingly retain their placement within the interquartile range. This delicate positioning indicates a market that, while tethered to its historical median performances, is also cautiously optimistic about future valuations. Conversely, a downturn is sensed within the Winter 2026 and 2027 contracts, as their prices exhibit declines without breaching the established upper quartile values, hinting at underlying market apprehensions about future supply and demand balances.
Forward Curve Insights
The forward curve, a graphical representation that outlines future contract prices over time, presents another fascinating narrative. The comparison of the 3-year delivery contract prices as of 2025 with those from 2023 and 2024 underscores a diminishing, albeit still evident, skewness in the curve. This skewness is particularly pronounced in both near-term (1-2 years) and distant (5-6 years) delivery segments, reflecting market anticipations of future scarcity or abundance.
Storage and Supply Dynamics
A critical component of market equilibrium is storage capacity and its dynamics. The projection for week 31 (spanning July 28 to August 03) anticipates a +16 BCF (billion cubic feet) gain in storage, a confident assertion that surpasses the median fill rate of the past five years. The consistent positive dynamics in injection rates alongside this prediction point to a market that is seemingly preparing for heightened demand or anticipating supply constraints. The goal of stabilizing at levels akin to the 2024 peak values remains within reach, pending the mitigation of seasonal fluctuations and weather-related disruptions.
Weather Patterns and Regional Variations
Weather plays an indispensable role in shaping energy supply and demand. The weekly HDD (Heating Degree Days) + CDD (Cooling Degree Days) totals, derived from current NOAA (National Oceanic and Atmospheric Administration) data, for the 32nd week highlight a market operating in accordance with 30-year average observations. However, an anticipated surge in HDD+CDD values in the subsequent week underscores the market’s sensitivity to seasonal and climate variables.
Regionally, the forecast for week 33 indicates elevated HDD+CDD across almost all regions, underscoring potential regional disparities in energy demand and supply dynamics. Such variations can have profound implications for localized energy pricing and supply chain logistics, highlighting the need for region-specific analyses in tandem with broader market assessments.
Supply-Demand Interplay
The current week’s supply-demand differential, a crucial marker of market health, has descended below the median, edging towards the lower interquartile range. On the demand side, a notable decrease in consumption by power generation sectors juxtaposes with a recovery in LNG (Liquefied Natural Gas) exports. Supply-wise, a sustained growth in production coexists with a decline in imports from Canada, painting a complex picture of interdependent supply chains and consumption patterns.
Conclusion
This in-depth examination, painstakingly prepared by Dr. Igor Isaev in collaboration with Anastasia Volkova, a London School of Economics analyst, paints a multifaceted picture of the energy market’s current state juxtaposed against its historical backdrop. From pricing trends and forward curves to storage dynamics and the pivotal role of weather, each component interlaces to form a comprehensive understanding of the energy sector’s intricacies. As the global energy landscape continues to evolve, these insights offer invaluable perspectives for industry stakeholders, policymakers, and observers alike, navigating the complex interplay of factors that shape our energy future.


