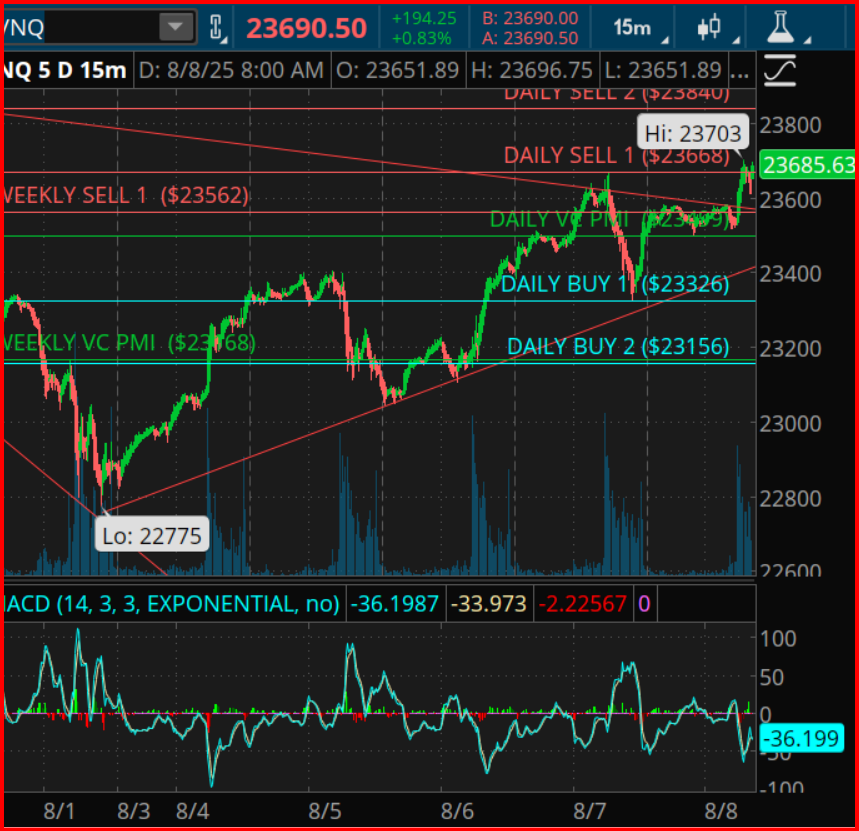
In the realm of financial trading, the analysis and anticipation of market movements stand as the cornerstone of successful strategies. One such analytical approach draws upon the principles established by W.D. Gann, a seminal figure in the field, whose methods of timing and prediction have influenced generations of traders. Our focus here shall be on the intriguing dynamics of the Nasdaq Composite Index, particularly its performance since the significant low observed on August 1st at 22,775 points. This point marked the beginning of a new swing, acting as an anchor for subsequent analyses employing Gann’s methodology.
A dive into Gann’s timing techniques reveals that he perceived time and price as interrelated dimensions, wherein specific intervals could signal potential turns or continuations within the market. Following the low on August 1st, Gann’s timing windows became particularly relevant for assessing potential market movements. The first such window, spanning 8 to 10 calendar days post-anchor—approximately aligning to what might be considered a Gann week—culminated between August 9th and August 11th. This period, interestingly, coincided with a stall in the market’s ascent, as the Nasdaq positioned itself just below the Daily Sell-1 barrier of 23,688 points. This phenomenon underlines the significance of timing in anticipating market behavior.
Further along the timeline, an 18-day window—akin to a Gann “square” extending just over two weeks—projects potential market activity between August 18th and August 22nd. A pivotal observation here is that, within this window, market strength could transition into a more cautious phase, potentially signifying a consolidation rather than an outright peak, provided the trend remains in its infancy. Subsequent windows at 30, 45, 60, and 90 days each serve as key markers, aligning unerringly with critical points of resistance and support within the market’s trajectory.
Marriage between Gann’s square-of-9 technique and the Volatility Price Market Indicator (VC PMI) unfolds another layer of market insight. The square-of-9 analysis, originating from the 22,775 baseline, weaves into the VC PMI to delineate potential resistance or support zones. Notably, a 180° rotation upwards from the base projects a resistance zone congruent with Daily Sell-2 around 23,840 points, serving as a testament to the intertwined relationship between varying analytical methods. Should the market elevate the 23,688–23,840 band from resistance to support, forthcoming higher price levels enter the realm of possibility within the designated timing windows.
Conversely, a downside perspective according to the square-of-9 points towards the Daily VC PMI and Buy-1 levels as significant markers. A drop below these levels during one of Gann’s timing windows could suggest a downward rotation towards the 23,326 or 23,156 points, without necessarily disrupting the broader market pattern.
Projecting into the future, a 360-day cycle analysis, grounded in the composite annual rhythm of the Nasdaq (NQ), anticipates a crucial turning point towards the end of September into early October. This prediction overlays with the 60-day and 72-day sub-cycles emanating from the August 1st baseline. Approaching this late-September to early-October window, market direction could definitively signal either a cyclical peak or a foundation for a Q4 rally, depending upon the preceding trend.
From a strategic standpoint, maintaining price levels above 23,562 points—now considered support following the Weekly Sell-1 mark—paves a less resistive path towards the 23,840 to 24,120 points corridor. Market behavior during the designated early August and mid-to-late August timing windows could further clarify the direction, with consolidation above 23,688 points favoring a gradual move towards the initially identified resistance level of 23,840 points.
In summary, the nexus of price bullishness and impending timing windows places a spotlight on the 23,840-point mark as an axis of market sentiment. Traders are guided to navigate these waters with the 23,562 and 23,491 levels as protective boundaries, employing Gann’s timing windows as a sieve for distinguishing between breakout potential and fade prospects.
As we peel away the layers of these intricate analyses, it becomes clear that trading, especially in the realms of derivatives, financial instruments, and precious metals brings with it inherent risks. Past performances, while informative, are not always reliable harbingers of future outcomes. Hence, it behooves participants in these markets to approach with caution, armed with as much knowledge and insight as strategies like those inspired by Gann can provide.


