In the spring season, the gold sector was notably robust, reaching levels of demand and valuation that signified a period of excessive enthusiasm among investors. This fervent buying spree was suggestive of a market segment that was ripe for a period of stabilization. As we’ve seen, the market has indeed entered a phase of correction, albeit in a manner that points to underlying strength, although it presently stands at a considerable remove from its 200-day moving average.
Simultaneously, indicators within the realm of gold mining equities are beginning to signal caution, presenting a nuanced portrait of the sector’s current state.
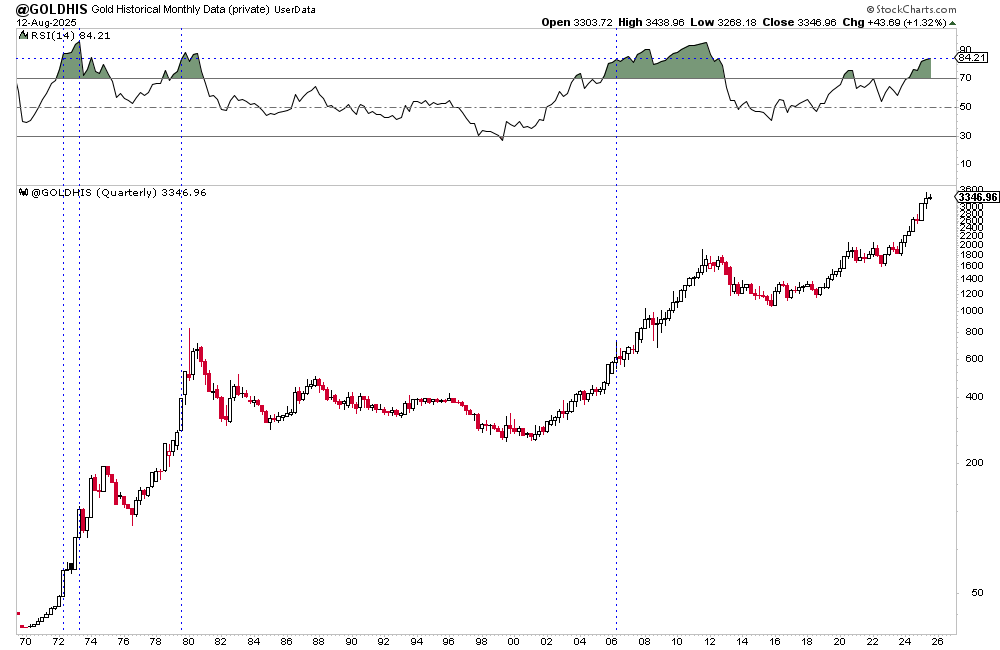
To understand the current dynamics at play, it is prudent to commence our analysis with a retrospective glance at gold’s quarterly performance. With the current quarter yet to conclude, preliminary insights can still be drawn from the Relative Strength Index (RSI) of gold on a quarterly basis.
Historically, moments of significant overvaluation in gold, as measured by the quarterly RSI, have been rare but notable. Instances in 1972, 1973, and 2006 marked periods where gold entered extremely overbought territories, akin to recent trends. Each of these previous occasions was followed by noteworthy corrections in the market. To illustrate, in 1972, the value of gold dipped by 12% over 4.5 months, inching to within 3% of its 200-day moving average. In a similar vein, 2006 witnessed a 23% correction over five months, while 1973 saw a more pronounced adjustment of 28% across 5.5 months.
Currently, the gold market echoes the initial stages observed in 1972, having undergone an 11% correction over nearly four months. This observation brings us to two potential outcomes. Initially, given gold’s recent inability to sustain a breakout, it may be poised for a lengthier period of correction, potentially nearing its 200-day moving average. Furthermore, should gold embark on another substantial increase surpassing the $4000 mark by 2026, it might then be at risk of enduring a correction of over 20%, mirroring the trends seen in 1973 and 2006.
Turning our gaze to the present, gold trades at $300 above its 200-day moving average in the spot market, and $280 above in the futures market. Speculation about the spot market testing the $3275 boundary is rife, with a potential downside ranging between $3150 and $3200 should this support level give way.
The relationship between gold and the stock market, indicated by a closing ratio of 0.52, finds substantial support between the 0.50 and 0.51 marks. The establishment of a trend reversal would necessitate a closing ratio above 0.54.
Meanwhile, in the realm of gold stocks, metrics such as the bullish percentage index, the golden cross percentage, and the proportion of HUI (NYSE Arca Gold BUGS Index) stocks above their 200-day moving average are all currently peaking at 100%. This reflects a conventional characteristic of bull markets, where strong breadth early in a trend is indicative of robust health. However, such extremes, if sustained, could also signal potential peaks in the market.
Exploring recent corrections further, the fourth quarter of 2024 saw a 23% correction in the junior gold mining sector, setting the stage for a vigorous recovery in April. Gold miners have recently outpaced broader market indices, indicative of sector strength. However, with gold possibly entering a correction phase till the end of the summer, it remains to be seen how miners will perform during this interval.
In terms of real performance, both GDX (VanEck Gold Miners ETF) and GDXJ (VanEck Junior Gold Miners ETF) are indicating bullish trends against traditional 60/40 portfolios. GDX’s performance, in particular, is suggesting a potential breakout from a decade-long base, a sentiment echoed by GDXJ’s movement as well.
The story of gold and gold stocks is at a pivotal juncture. With gold having corrected for nearly four months but still significantly overbought in the long-term perspective, and gold stocks outperforming in this window, the sector is ripe with both opportunities and caution. A further corrective phase for gold, bringing it closer to its historical moving average, while allowing the overextended stocks to normalize, could offer a healthier foundation for future growth.
In addressing potential volatility and correction risks, an astute approach involves selecting fundamentally strong companies with attractive valuations. This strategy not only hedges against short-term market fluctuations but positions investors to capitalize on the long-term appreciation potential inherent in this lustrous commodity and its associated equities.


