


The world of finance and global markets is ever-evolving, reacting sensitively to the geopolitical events unfolding across the globe. The recent downturn in e-mini futures, witnessed during today’s Asian trading session, where they fell by 1.80%, exemplifies such volatility. This decline was primarily attributed to the resurgence of cautious market sentiment following Israel’s airstrikes on key Iranian nuclear and military installations.
Simultaneously, fears concerning potential disruptions to energy supplies through the Strait of Hormuz have triggered a notable surge in oil prices, with an increase of 10%. This upswing in the cost of oil, especially the West Texas Intermediate (WTI) and Brent crude, is poised to further complicate the economic strategies of major financial institutions, including the United States Federal Reserve. These institutions are grappling with inflation and the delicate task of managing interest rates without stifying economic growth.
In the intricate web of global finance, the actions of the Federal Reserve (Fed) in the United States wield significant influence. Presently, data extrapolated from the CME Fed Watch Tool indicates market anticipation. The market is gearing up for the Fed to potentially lower the Fed funds rate by 25 basis points, adjusting it to a range between 4.00% and 4.25% during the September Federal Open Market Committee (FOMC) meeting. This anticipated adjustment marks a pivotal shift, being the first rate reduction after a prolonged period of rate steadiness since December 2024.
However, with oil prices on the rise, the Federal Reserve might adopt a more cautious, “wait and see” approach. Such a stance is likely to usher in tighter liquidity conditions, significantly affecting the dynamics of the financial markets. This tightening could prompt a ripple of negative feedback across US stock indices, with potentially more pronounced effects on higher-beta assets. An illustrative example of this phenomenon can be seen through the recent performance of the Nasdaq 100 CFD Index. Here, the market’s response to shifting monetary policies and their implications on liquidity has been palpably negative.
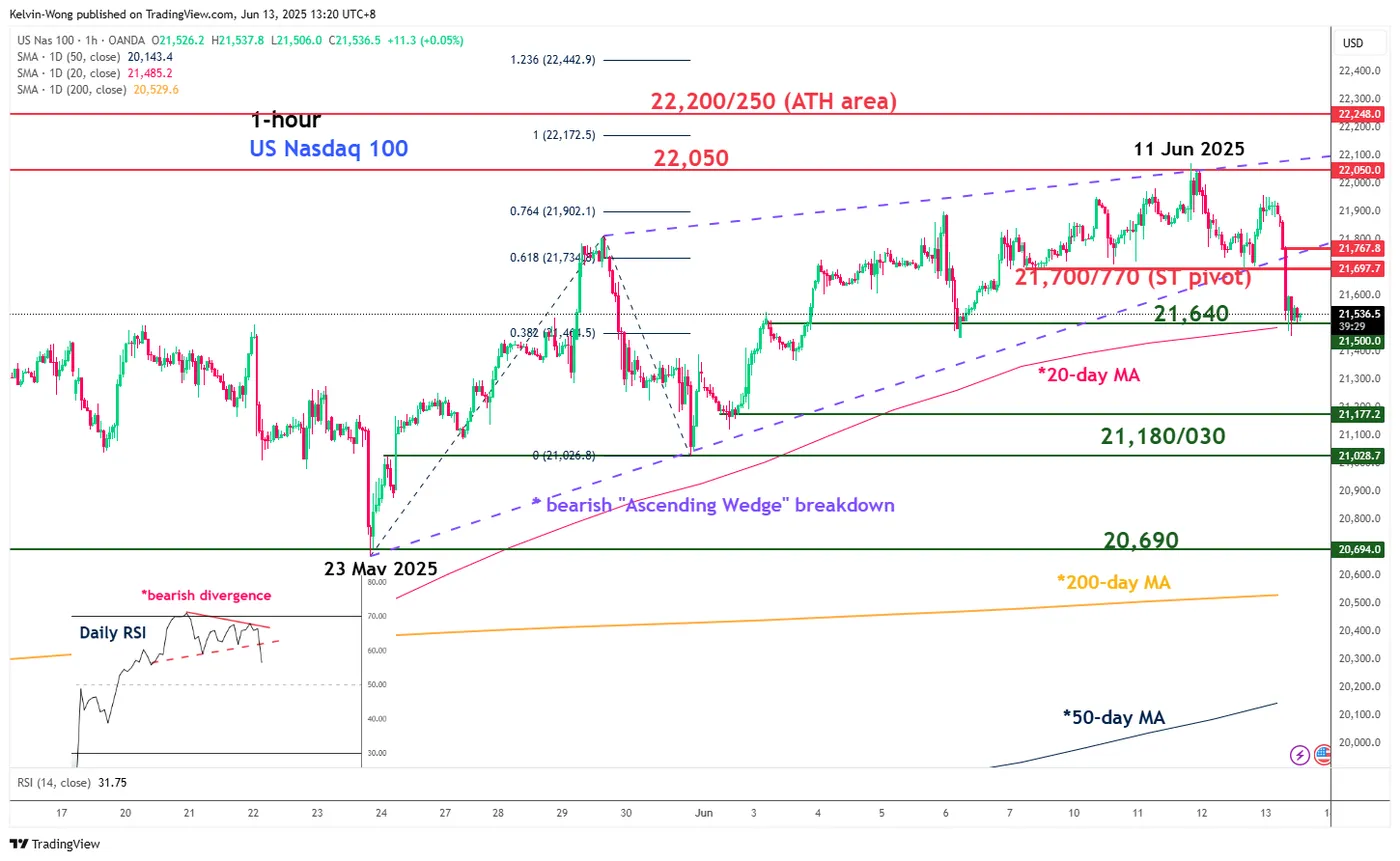
The Nasdaq 100 CFD Index, serving as a proxy for the Nasdaq 100 e-mini futures, has recently demonstrated a bearish trend. Key resistance levels around 21,700/21,770 have been highlighted, with the Index breaking below near-term support at 21,640, which aligns with its 20-day moving average. This decline exposes further intermediate support levels at 21,180/21,030, stretching down towards 20,690, in proximity to the 200-day moving average.
Diving deeper into the technical analysis, the Nasdaq 100 CFD Index recently breached a minor bearish “Ascending Wedge” formation that had been in place since the low on 23 May 2025. This breakdown led to an intraday loss of -1.7%, erasing the gains accumulated from the commencement of the week. This trend indicates a potential minor top formed around 11 June, showcasing the fluctuating nature of the market.
Moreover, the Daily Relative Strength Index (RSI) momentum indicator has pointed towards a bearish divergence condition, having broken below a key parallel support. This technical analysis suggests further potential weaknesses in the Nasdaq 100 CFD Index, heralding a cautious approach for traders and investors alike.
Nevertheless, there exists an alternative scenario wherein if the Index breaks above the pivotal resistance at 21,770, it would invalidate the prevailing bearish outlook. This breakthrough could potentially usher in a bullish phase, with the Index testing intermediate resistance levels at 22,050, eventually aiming for the all-time high zone around 22,200/22,250.
As the global geopolitical landscape continues to influence the financial markets, investors and analysts alike remain vigilant. The delicate interplay between geopolitical events, the strategies of central banks, and the resultant market reactions underscores the complexities of navigating the modern financial ecosystem.
This scenario, unfolding in the wake of Israel’s airstrikes and the subsequent turmoil in oil prices, provides a vivid illustration of the challenges faced by market participants. It also highlights the intricate connections between global events and financial market dynamics, underscoring the importance of informed decision-making in the pursuit of investment and economic stability.
The e-mini futures have plummeted by -1.80% in today’s Asian session at this time of the writing, due to a resurgence of risk-off sentiment over Israel’s airstrikes on Iranian nuclear and military targets.
spiked by 10% over fears of energy supply disruption in the Strait of Hormuz. A firmer upward drift in the prices of WTI and is likely to complicate the US Federal Reserve’s plan to cut .
Tighter Liquidity Conditions May Trigger a Negative Reaction in US Stock Indices
Based on the latest data from the CME Fed Watch tool, the Fed funds futures market is expecting the Fed to cut the Fed funds rate by 25 basis points (a 98% probability) in the September FOMC meeting to 4.00%-4.25%, its first cut after being on hold since December 2024.
Another “wait and hold” stance by the Fed due to higher oil prices is likely to create a liquidity tightening condition, in turn, triggering a potential negative feedback loop into US stocks, and the higher beta may see a higher magnitude of declines over the , and .

Fig 1: Nasdaq 100 CFD Index minor trend as of 13 June 2025 (Source: TradingView)
Preferred Trend Bias (1 to 3 days)
Bearish with key short-term pivotal resistance at 21,700/21,770 for the Nasdaq 100 CFD Index (a proxy of the Nasdaq 100 e-mini futures), and a break below the near-term support at 21,640 (also the 20-day moving average) exposes the next intermediate supports at 21,180/21,030, and 20,690 (close to the 200-day moving average).
Key Elements
Today’s price action of the Nasdaq 100 CFD Index has just broken down below a minor bearish “Ascending Wedge” configuration in place since the 23 May 2025 low.
The current intraday loss of -1.7% has wiped out all the gains seen so far this Monday, 9 June, which suggests a potential minor top has been made on 11 June.
The daily RSI momentum indicator has traced out a bearish divergence condition and broken below a key parallel support that supports a likelihood of further weakness in the Nasdaq 100 CFD Index.
Alternative Trend Bias (1 to 3 days)
On the flip side, a clearance above 21,770 key resistance invalidates the bearish scenario to reinstate the bulls for a retest on the next intermediate resistance at 22,050, and above it sees the all-time high area coming in at 22,200/22,250.

