


The Intricacies of the Shooting Star Candlestick Pattern: A Comprehensive Analysis
In the realm of financial markets, the shooting star candlestick pattern emerges as a significant harbinger of bearish reversals, especially following a period of upward trend momentum. Characterised by a modest real body situated at or near the trading range’s lower extremity, the pattern’s colour pales in significance compared to its structural and positional attributes. The defining feature of a shooting star pattern is its elongated upper shadow, typically twice the length of the real body or more, which narrates a tale of a trading session where buyers initially dominated, elevating the price substantially, only for sellers to take over and nullify the gains by the session’s end. The ideal formation sees minimal to no lower shadow.
The shooting star pattern gains additional validation and reliability when observed on a weekly or monthly timeframe compared to a daily chart. This is primarily because these longer timeframes encapsulate a broader spectrum of trading data, thereby offering a more consolidated view of market sentiment and price action dynamics. My weekly publications delve into these extended timeframes for analysis, recognising the value they bring in filtering out market “noise” – those daily or intraday fluctuations driven by ephemeral news events or algorithmic trading activities that might not necessarily reflect a fundamental shift in market disposition.
Understanding the security or asset’s weekly performance provides a richer context. It encapsulates the entire week’s opening and closing narrative – a journey from initial optimism to eventual rejection by the market forces, which is often considered a more robust indicator of market sentiment reversal, capturing the collective decision-making of a diverse participant base, from institutional investors to long-term traders.
Case Study: The Semiconductor ETF (SMH)
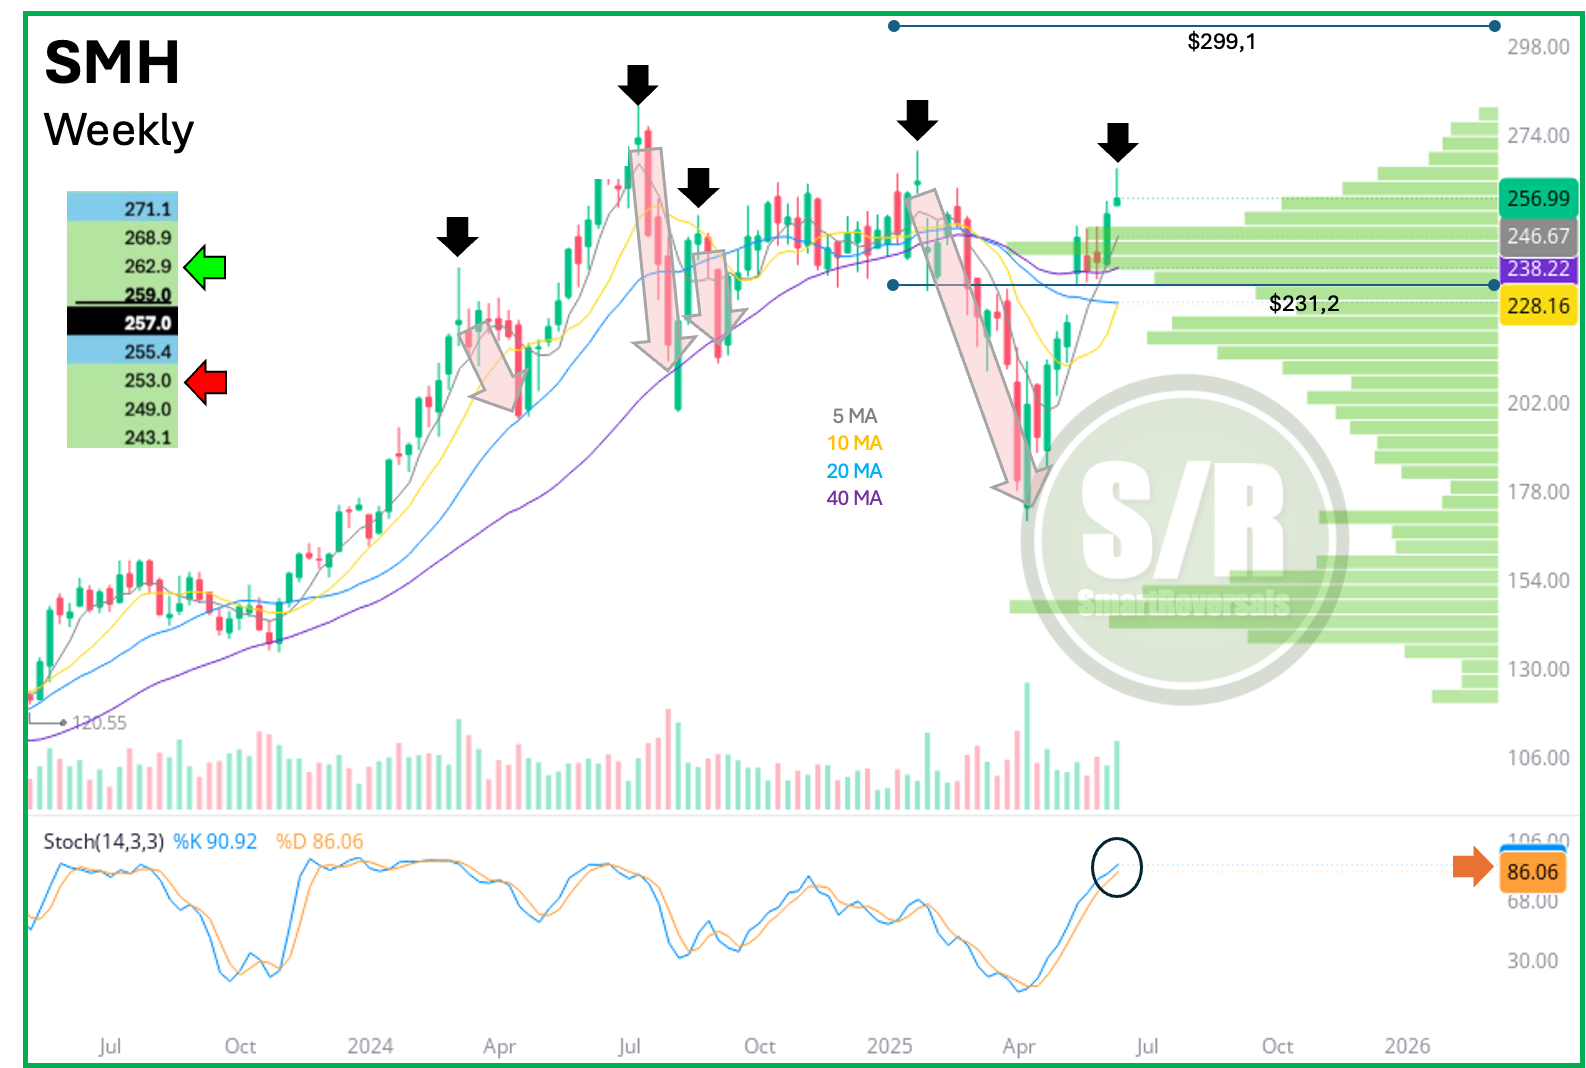
A prime exemplar of the shooting star pattern manifesting potent predictive potential is observed in the Semiconductor ETF (SMH). Within this weekly timeframe, specific occurrences highlighted by black arrows point towards historical precedents where such formations have led to downturns, approaching 20 or 40-week moving averages, and in some instances, precipitating deeper market corrections.
Another layer of analysis pertains to the ‘volume shelf’ from $231.2, which is poised to offer substantial support, enhancing the resilience of those levels enclosed within this volume-at-price shelf compared to those lying outside it. In my analysis published on a Friday, examining over 40 securities including SMH, key support and resistance levels were earmarked for the week ahead. These levels, once breached or held, signify momentum shifts, effectively guiding investment decisions.
Further Illustrations: GOOG and AAPL
The unfolding narrative of the shooting star pattern finds resonance in other tech giants, such as Alphabet (GOOG) and Apple (AAPL), each showcasing unique outcomes post the appearance of this pattern. For instance, Alphabet’s encounter with a shooting star signalled potential pullback opportunities, guided by specific price levels crucial for trend confirmation or reversal. In contrast, Apple’s trajectory in 2025 illustrated a pronounced downward spiral, vividly captured through a succession of lower highs and downward corrections, all commencing from a distinct shooting star appearance.
This pattern of lower highs and lows, particularly the precision with which certain price levels acted as resistance or support, underscores the nuanced understanding required to interpret these signals within wider market contexts. It hints at an intricate dance between bullish optimism and bearish pragmatism, with the shooting star often acting as a pivot around which market sentiment visibly shifts.
Concluding Thoughts
The exploration of the shooting star candlestick pattern, through the lens of specific case studies and analysis of securities like SMH, GOOG, and AAPL, delineates its critical role in forecasting market reversals. It’s a testament to the pattern’s enduring relevancy in the analytical toolkit of traders and investors, offering a window into the market’s soul, revealing moments of weakness in prevailing trends.
While the technical intricacies of financial market analysis are vast and varied, the shooting star pattern stands out for its clarity and potency, especially when interpreted within the broader tapestry of market behaviour over extended timeframes. It embodies the perpetual struggle between bullish fervor and bearish caution, serving as a pivotal marker for those adept at reading the signs.
As we continue to navigate the complexities of financial markets, such patterns offer guideposts, illuminating the path for strategic decision-making. However, it bears reminding that these insights should form part of a comprehensive analysis strategy, considering market fundamentals, macroeconomic indicators, and other relevant data points. In essence, the journey through the markets is one of perpetual learning, adapting, and strategizing, with the shooting star pattern providing a key piece of the puzzle.
Disclaimer
It’s important to note that this content is intended for educational purposes only and should not be construed as investment advice. Financial market investing involves risk, and it’s advisable to conduct thorough research or consult with a financial advisor before making investment decisions.
A shooting star candlestick is a bearish reversal pattern that typically appears after an uptrend. It has a small real body (the thick part of the candle), which is at or near the bottom of its trading range, and its color is less important than its shape and position.
It has a long upper shadow (the thin line extending upwards from the real body) that is at least twice the length of the real body. This long upper shadow indicates that buyers pushed the price up significantly during the period, but sellers ultimately rejected the higher prices and pushed the price back down. Ideally, there is little to no lower shadow or wick.
While a shooting star on a daily chart can provide a valid signal, observing it on a weekly chart lends it greater weight and reliability as a potential indicator of a significant bearish reversal.
My publications on Saturdays consider longer than daily timeframes since they have more data points, a weekly or monthly candle encompasses in general five daily trading sessions (depending on holidays/weekend trading, or crypto/futures). This means it consolidates a much larger volume of price action and market sentiment into a single candle.
Shorter timeframes (like daily or intraday charts) are more susceptible to “noise” – random fluctuations, news-driven spikes, or algorithmic trading that might not reflect a fundamental shift in market sentiment. A pattern on a weekly chart filters out much of this noise, making the signal more robust.
When a shooting star forms on a weekly chart, it implies more conviction, since over an entire week, the market opened, attempted to push higher significantly, but was ultimately rejected by sellers, closing near the low of that week. This represents a stronger and more sustained rejection of higher prices by a broader range of market participants (institutional investors, long-term traders) than a rejection that occurs over just one day.
Case Study: SMH
The Semiconductor ETF () provides a perfect illustration of a shooting star candlestick on its weekly timeframe. The black arrows in the chart highlight this formation, which historically preceded declines towards the 20 or 40-week moving averages, and even deeper corrections, as witnessed in April. The overbought oscillator further reinforces the potential for a pullback.
The volume shelf, originating from $231.2, is expected to provide substantial support. Any support level situated within this green volume-at-price shelf is inherently stronger than those outside it, whether above or below.
On Friday, June 6th, I published the support and resistance levels for the week ahead including SMH in over 40 securities. In that analysis, $249 was identified as the level dictating bullish momentum if the price remained above it. The bullish targets, or layers, were set at $259.5, which caused a temporary rejection on Monday, and $266.3, which indeed acted as a firm ceiling for semiconductors. Consequently, the price retraced from that zone, printing a weekly bearish candle.
The levels for next week were updated on Friday again.
The price closed on Friday at $257, as highlighted with the black background on the right price scale in the chart below. This closing price is below the central weekly level for next week, which is $259 (bold and underlined). Therefore, if the price remains below this level, the shooting star formation gains further validation, and the next immediate target would be $253. While $255 might offer some monthly support, its proximity to Friday’s closing price is notable. Moreover, this weekly formation typically precedes deeper corrections, as indicated by the red-transparent arrows in the chart.
If SMH successfully recovers its $259 key level (as some shooting stars serve as early warnings followed by a final spike before the actual pullback), $262 becomes the next resistance zone or target to assess for a potential bearish reversal.

In general, the Semiconductor ETF has been presenting a series of lower highs since July 2024, when some semiconductors stocks peaked (Micron Technology (NASDAQ:), Advanced Micro Devices (NASDAQ:)), and others set a notable high that has been slightly surpassed before falling again for a consolidation (NVDA, Texas Instruments (NASDAQ:)). Only Broadcom (NASDAQ:) is setting fresh all time highs but also with a shooting star.
GOOG
Another example of a shooting star, in this case price found rejection at $176, a long term level that as of today is proving its strength, and considering how overbought is becoming the Stochastic oscillator, there are good chances to see a pullback.
That said, the bearish setup for is validated as long as the price stays below $177 next week, which is the central level updated, suggesting a descent towards $172. If Alphabet (NASDAQ:) can re-establish itself above the $177.3 central weekly level, the price could target $181 before reversing.
It’s worth noting that similar shooting star candles were printed in November 2024 and January 2025, both presented bullish follow through for one and three weeks respectively, before notable pullbacks. (each security has its own “personality”, don’t take the 1-3 weeks as a rule for the , TSLA, or other securities studied today).

AAPL
The weakness in Apple (NASDAQ:) is unparalleled; 2025 has presented a continuous downward trajectory, and over the last three months, a symmetric series of lower highs has been notably evident. Last week’s candle initially suggested some continuation, but $203, which served as the central level for the week that just ended, acted with precision as resistance.
The sequence of lower lows now strongly suggests that the $192 long-term level will be tested. As long as the price remains below $199.4 (the central level for next week), $192 is the immediate next destination.
The broader picture reveals $192 as an annual level, with the monthly levels showing $191 as a line to watch. Furthermore, the immediate bearish level for the week is $192.8. This confluence indicates two key points:
$192 represents a confluence zone of annual, monthly, and weekly levels, suggesting it may act as support. However, this must be proven by price action.
The weekly candle shows conviction, and $192 is very close to the latest price. If the $192 zone is breached, a major resistance level would be established, and the world’s third-largest company by market cap would continue to hinder the major indices from reaching all-time highs.
Conversely, if a Doji candle forms on Monday, or if an intra-week sell-off bounces and recovers $199.4, the price could then aim for $202.7. This is the monthly central level, which is currently acting as resistance and provides further reference for Apple’s bearish momentum.
The analysis with the same approach and target prices for SPX, , , , , , , , , , , , , AMZN, and MSFT can be found in my homepage
Disclaimer: This content is educational and not intended to be investment advice.

