


In recent times, the global financial markets have been awash with optimism as we inch closer to the forthcoming G7 summit. This buoyant atmosphere has certainly not gone unnoticed by stakeholders in the financial ecosystem. The transition of index futures from their June contracts to the September ones, completing a contango, symbolizes this mood. For those who might not be familiar, contango is a situation where the futures prices of commodities or indices are higher than their spot prices, typically indicating an upward trend in the market. This phenomenon is a notable feature of markets that have observed an upward trajectory over the last 18 years.
However, the significant uplift in equities is not solely attributed to the dynamics of futures contracts. The announcement by Iran of its desire for a ceasefire with Israel marks an optimistic turn of events, potentially averting what could have escalated into a far more tumultuous conflict. The fact that this development has occurred without the need for US intervention adds a layer of positive sentiment, pacifying market fears and leading to a notable upswing in all US Equity indices, with increases surpassing 1.2% on the day.
At the forefront of these gains is the Nasdaq, which at the moment of writing, is observing a 1.35% increase. This rally is even more significant considering it rebounds from a sharp drop experienced last Thursday, hinting at a robust recovery and a healthy appetite for risk among investors.
Diving into a bit more granular detail, the technical analysis of the Nasdaq 100 provides a fascinating insight into the current state of the market. Despite daily charts indicating a hover around 1.5% below the all-time highs of January 2025 (22,241) and a flirtation with overbought conditions as per the Daily Relative Strength Index (RSI), the current market dynamics paint a bullish picture. This is further accentuated by a potential Daily Golden Cross, a typically bullish market indicator, as the MA 50 closes in on the MA 200.
Yet, not all is smooth sailing. Speculation around the Federal Reserve’s forthcoming FOMC meeting, where economic forecasts are to be unveiled, introduces a degree of caution among investors, potentially slowing down the momentum.
Zooming into the Nasdaq 100’s 4-hour chart, the previous sessions’ downturns now appear as mere technical retracements rather than fundamental downturns. Prices are rebounding impressively, eyeing the psychologically significant 22,000 level, with RSI levels suggesting there’s room for further growth without entering overbought territory. This uptrend, however, might face headwinds from global economic events, such as potential hawkish stances from central banks like the Bank of Japan, which could impact carry trades benefiting US Equities.
The 1-hour chart reveals a relentless pursuit of higher highs, breaking past the thresholds set last Thursday. However, as RSI levels flirt with overbought conditions, markets might witness some consolidation, especially as traders exercise caution ahead of critical central bank rate decisions. The strategic positioning of moving averages could serve as a magnet for this potential consolidation, setting a backdrop for the next pivotal movements.
An additional element contributing to this rapid reversal is attributed to the swift accumulation of short positions amid heightened market volatility, with their subsequent unwinding contributing significantly to bullish momentum.
As the market navigates these intricate dynamics, eyes are keenly set on overcoming the next resistance levels, propelling towards the historic high resistance zones around the 22,000 marks.
In a financial landscape that remains as unpredictable as ever, these developments remind us of the intricate interplay between geopolitical events, technical indicators, and market sentiment. As we move forward, navigating these waters with caution and a well-informed strategy remains paramount for traders and investors alike, underscoring the mantra of ‘Safe Trades!’.
Given these multifaceted influences shaping market dynamics, understanding the pulse of global events, alongside technical and fundamental analyses, becomes crucial for those looking to maneuver through the financial markets with acumen and agility.
The euphoric mood in markets has not failed to surprise any players as we approach the upcoming G7 meeting.
Index futures complete their contango transition from the June to the September contracts.
For a quick reminder, a contango happens when futures pricing is above spot pricing, the more typical pricing for futures, as markets always price a time premium. This is considered positive, as markets have been trending upwards in the past 18 years.
However, the role of futures contracts is far from the only component allowing Equities to rise: Iran’s freshly announced demands for a ceasefire with Israel are taken as an optimistic development to what could have been a much more chaotic conflict.
The US hasn’t even had to step in, allowing market fears to reverse sharply: All US Equity indices are trading above +1.2% on the day.
The is once again leading gains, up 1.35% as we speak, as prices are overlapping last Thursday’s highs before the risk-off sharp fall.
Let’s take a look at what that implies for technical signals going into the Wednesday 18th .
Nasdaq 100 Technical Analysis
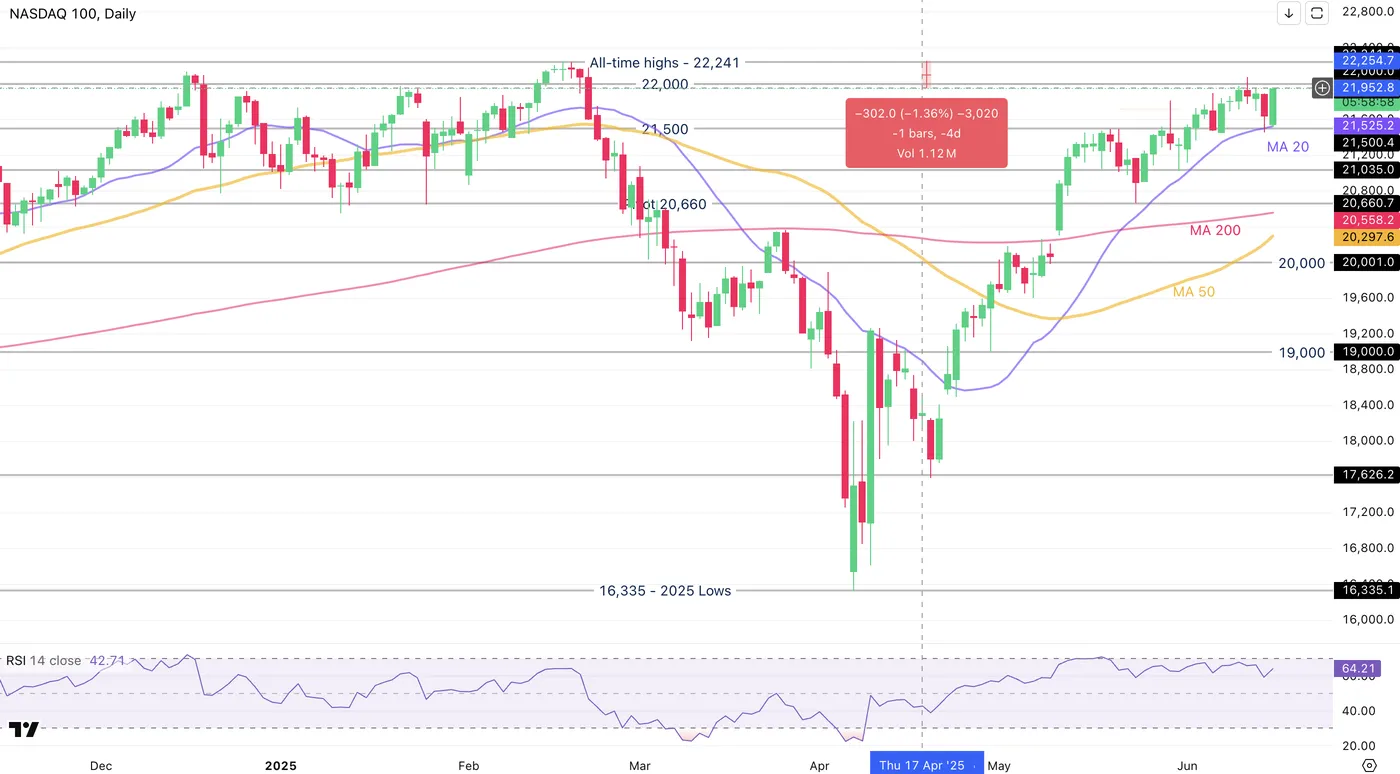
Nasdaq 100 Daily Chart

Source: TradingView
Daily charts are showing further consolidation around and below 1.5% from the January 2025 all-time highs (22,241) – Even with the Daily RSI just hovering around overbought conditions, supported by its Moving Average 20.
The current daily candle is a bullish engulfing candle as markets erase the end-of-week correction, though prices will have to rally further to break last Wednesday post- highs of 22,074.
One thing to note is that a further rise in the Index would create a Daily Golden Cross as the MA 50 gets closer to cross above the MA 200 – A typically bullish signs for Markets.
One fundamental hurdle to this outcome is a potential slowdown from buyers as key players prepare their position books for the important FOMC meeting where Summary of are released – the Federal Reserve’s economic forecast.
Nasdaq 100 4H Chart

Source: TradingView
Last Thursday and Friday, moves now only look like a technical healthy retracement with prices now rebounding sharply on the 4H MA 20 and 50.
Buyers will have to keep rallying towards the 22,000 psychological level – less than 50 points away. The RSI is rising and still has space before the move gets overbought.
One other fundamental hurdle is potential hawkish talk from the Bank of Japan in tonight’s which would slow down Carry trades, which are so beneficial to US Equities.
Technical hurdles are thin, though we will spot them with more details in the 1H chart right after.
Nasdaq 100 1H Chart
Source: TradingView
The Nasdaq is smashing through last Thursday’s highs of 21,957 with the up-move stalling slowly as the RSI indicates overbought conditions.
Look at 21,930 for the low of the immediate pivot/resistance zone where we are currently trading.
Key 1H moving averages are all around the same spot 200 points below and may act as a magnet for consolidation as buyers may take their foot of the pedal ahead of key Central Bank rate decisions. The MAs are at a confluence with the immediate support zone between 21,700 and 21,730.
One other component to such a sharp reversal is a quick accumulation of short positioning as market fears create added volatility – The unwinding of such positions create strong reversal candles such as the consecutive bull candles since the Sunday gap down open.
The next key resistance except for the one prices are trading in right now is the post-CPI highs mentioned earlier – a break of the 21,074 and consolidation above would point towards the All-Time High resistance zone around 22,000.
Safe Trades!

