


In the complex world of financial markets, one currency pair that often captures the attention of traders and analysts alike is USD/JPY. Recently, this pairing has seen some interesting movements worth exploring in greater depth, especially when viewed through the lens of technical analysis – a discipline within financial analysis that evaluates investments and identifies trading opportunities by analyzing statistical trends gathered from trading activity.
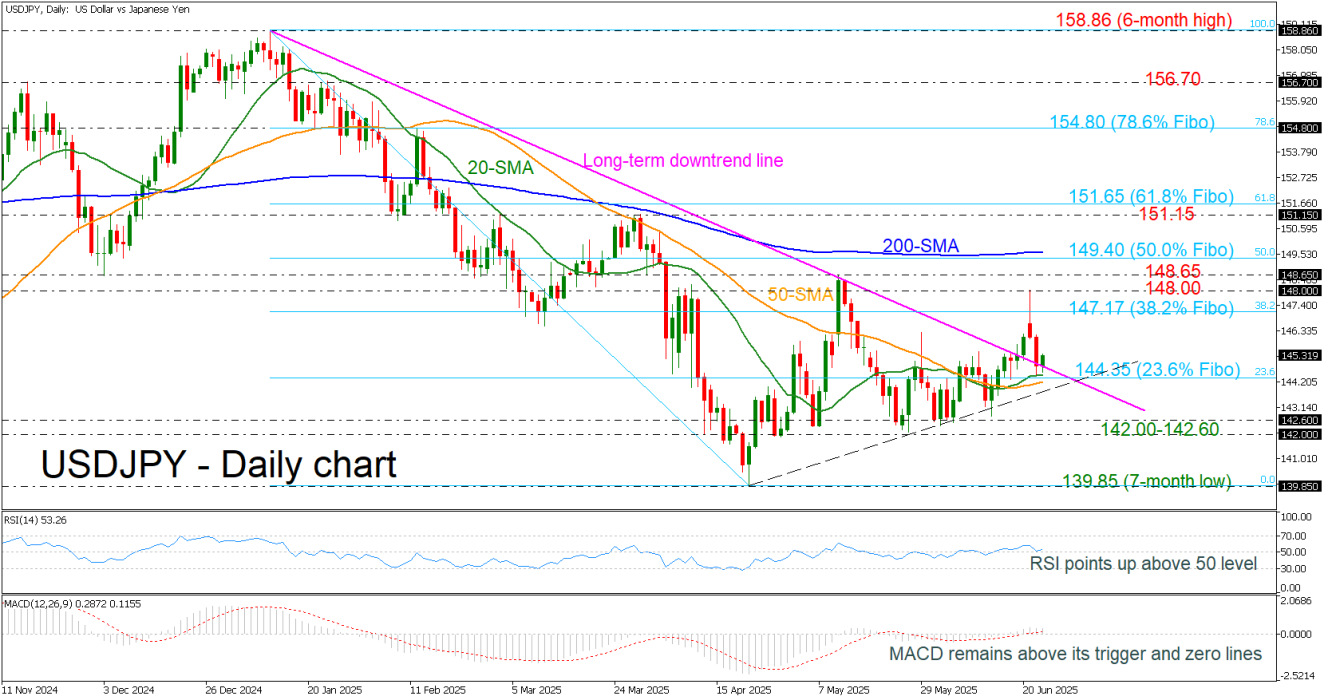
The USD/JPY currency pair, representing how many Japanese yen can be exchanged for one US dollar, has recently experienced a formidable recovery, bouncing from the 23.6% Fibonacci retracement level. This specific level, situated at 144.35, holds particular significance as it encapsulates the decline from an apex of 158.86 down to a trough at 139.85. Notably, this levitation above the 144.35 mark coincides with a previously established descending trend line, which has now transitioned into a support role amid subsiding geopolitical tensions—a nuanced development in the ongoing narrative of global politics and economics influencing market trends.
For those unfamiliar with the terms used in technical analysis, a quick dive into the concepts mentioned will be helpful. Fibonacci retracement levels are widely used indicators that can predict future levels of support or resistance, based on the premise that markets will retrace a predictable portion of a movement, after which they will continue to move in the original direction. Similarly, SMAs, or simple moving averages, smooth out price data to create a single flowing line, making it easier to identify the direction of the trend.
The current position of the USD/JPY pair above this critical trend line suggests the potential for continued bullish momentum, which could propel the pair towards the 38.2% Fibonacci retracement level at 147.17, and subsequently, towards the psychologically important 148.00 threshold. Should the upward trajectory maintain its course, further escalations could target the 148.65 resistance level, eventually challenging the formidable 200-day simple moving average (SMA) stationed at 149.40—a significant barrier historically.
Conversely, should the pair succumb to downward pressure and descend below the short-term SMAs, alongside relinquishing the 144.35 support level, it could exacerbate bearish dynamics, thus unveiling the 142.00–142.60 zone to potential vulnerability.
From an analytical perspective employing technical analysis tools, the Relative Strength Index (RSI) and the Moving Average Convergence Divergence (MACD) offer valuable insights into the currency pair’s current state. The RSI lingers slightly above the neutral threshold of 50, intimating a mild bullish inclination. On the other hand, the MACD’s sideways movement above its signal and zero lines denotes an absence of pronounced directional momentum, suggesting a period of uncertainty or consolidation.
Therefore, the cumulative assessment of the USD/JPY pairing denotes a cautiously optimistic outlook, contingent significantly upon its sustenance above the pivotal 144.35 support level and the erstwhile descending trend line. A decisive breach above the 200-day SMA would serve as a robust affirmation of the bullish sentiment enveloping this currency pair.
Understanding these technical mechanisms provides invaluable insights into the inherent volatility and trends dominating financial markets, particularly within the competitive arena of foreign exchange. For beginners and seasoned traders alike, delving into these analyses aids in comprehending the undercurrents that drive currency valuations, offering a strategic edge in navigating the complexities of international finance.
Additionally, it’s paramount to highlight the broader geopolitical and economic landscapes that indirectly shape the narrative of currency pairs such as USD/JPY. Influences ranging from changes in monetary policy, economic sanctions, trade deals, and shifts in the geopolitical stability of regions can all precipitate fluctuations in currency values. As such, traders and analysts must remain vigilant, continuously integrating technical analysis with a keen understanding of global events to make informed decisions in the fluid and oftentimes unpredictable realm of currency trading.
In conclusion, while the short-term outlook for USD/JPY appears cautiously optimistic supported by technical indicators, it’s the melding of these analytical insights with a broader understanding of geopolitical and economic developments that will truly empower investors and traders to navigate the vicissitudes of the market with confidence and strategic acumen.


