


As we delve deep into the dynamics of the currency exchange market, specifically focusing on the NZD/USD currency pair, a compelling narrative unfolds. The New Zealand Dollar against the US Dollar provides a riveting example of how global economic fundamentals and technical chart patterns can guide traders and investors in making more informed decisions. This comprehensive analysis aims to dissect the trends, providing both newcomers and seasoned market enthusiasts with a clearer understanding of the ongoing fluctuations.
A Pivotal Movement within the NZD/USD Pair
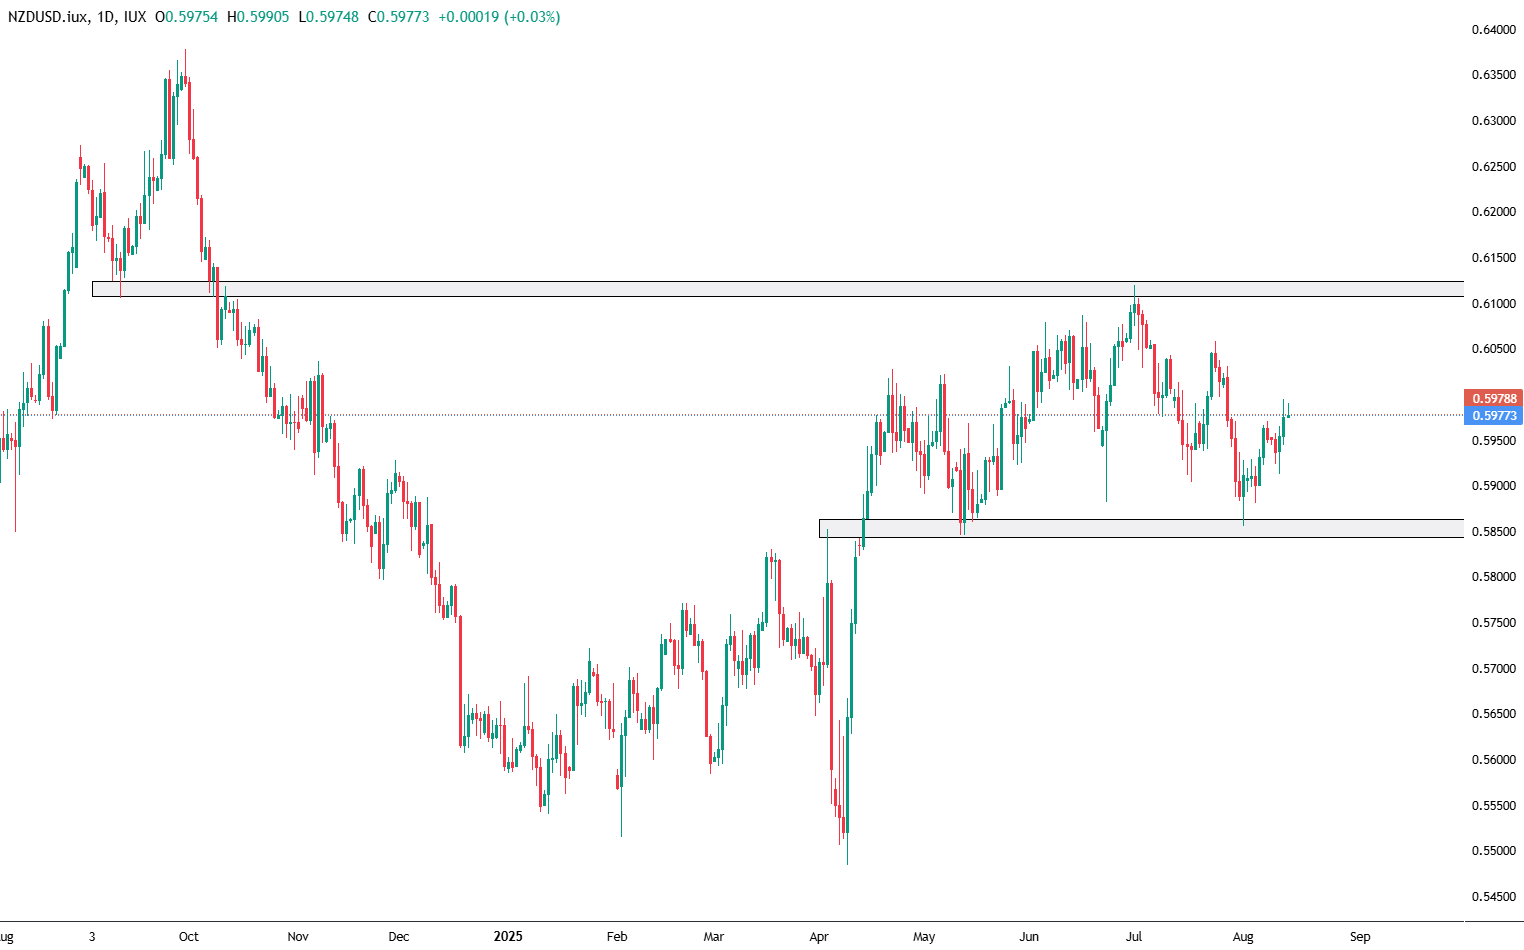
Upon observing the current state of the NZD/USD pair, it’s apparent that it has recently rebounded from a significant support area located between 0.58697 and 0.58497. Highlighting a moment of reversal, this movement signals a newfound momentum towards an established resistance trendline. This trendline itself is a culmination of earlier market behavior, suggesting a potential breaking point or a continued trajectory dependent on forthcoming market forces.
The graphical representation vividly captured in the Daily Chart of August 14, 2025, emphasizes these claims. Through visual aids, traders can discern the intricate patterns forming, suggesting a critical juncture that may define the short to medium-term outlook for this currency pairing.
Diving into the Core of Fundamental Analysis
The story behind these movements is deeply rooted in economic data and fundamental indicators which shed light on the broader economic landscape. As of June 2025, the United States witnessed no change in its Producer Price Index (PPI) compared to the previous month, defying expectations of a 0.2% increase after an upward revision of 0.3% rise was reported earlier. Such stagnation is unusual and merits a closer examination. Specifically, the downward shift in services prices, led notably by a 4.1% dive in traveler accommodation services, against a backdrop of an increase in goods prices, notably communication and related equipment by 0.8%, paints a complex picture of the current economic situation.
When dissecting annual producer inflation, a decrease to 2.3%, the lowest measure since September 2024, is observed, juxtaposed with an anticipated gradual incline to 2.5%. The dichotomy extends to the core PPI as well, which flattened and diverged from the expected 0.2% rise, signaling nuanced inflationary pressures beneath the surface.
-
The Subtleties of PPI Headline Increase: A 0.2% uptick signals unexpected price pressures at the producer level, which could inherently suggest that rising production costs might transfer to consumers, fuelling the fires of inflation further.
-
The Intricacies of Core PPI: Despite a decrease from the previous month’s figures, the persisting 0.2% rise in Core PPI, which excises the volatile food and energy sectors, indicates an undissipated inflationary pressure within the production chain, raising important questions about the economy’s trajectory.
-
Monetary Policy Implications: These inflationary undercurrents at the producer level may reinforce the Federal Reserve’s (Fed) hawkish stance, complicating any immediate decisions regarding interest rate cuts. Persistent inflationary pressures could indeed delay such monetary policy adjustments.
-
Examining Market Impact: Historically, the US Dollar strengthens against other currencies amid higher-than-expected inflationary pressures. Furthermore, this inflationary environment may maintain high short-term interest rates or potentially elevate them, impacting bond prices negatively and exerting pressure on equity markets, especially those sensitive to discount rates.
An In-depth Technical Analysis Perspective
When shifting focus to a lower timeframe, such as the H4 chart dated August 14, 2025, one can identify a trend line extending from a previous peak to approximate the current price level. This observation could provide traders with an opportune moment for engagement with the pair. The potential for capturing a reversal or confirming a continuation in trend becomes apparent when the price interacts with this trendline, reflecting either selling pressure or strong upward volume, respectively.
Further technical indicators like the EMA50 and MACD underline the current uptrend’s strength, serving as supportive references for trading decisions augmented by confirmatory signals such as candlestick patterns.
Navigating Through Levels & Zones for the NZD/USD Trade
The delineation of support and resistance zones offers strategic entry and exit points for traders. For instance, immediate support zones lie between 0.55689 and 0.55491 for long-term considerations and 0.58637 – 0.58439 for medium-term outlooks. Conversely, resistance zones poised for testing are at 0.63573 – 0.63737 for long-term barriers and 0.61082 – 0.61247 for medium-term obstructions.
To encapsulate, the nuanced movements of the NZD/USD currency pair, coupled with the underlying economic indicators, paint a multifaceted picture of the current market landscape. Through this detailed exploration, traders and investors can gain a deeper understanding, equipping themselves with the knowledge to navigate the volatile waters of the currency exchange market.


