


The shape of the United States yield curve is frequently interpreted as a barometer for forecasting the nation’s economic health, specifically in regard to assessing the likelihood of a forthcoming recession. It operates on a principle where an inversion in this yield curve generally precedes an economic downturn. Despite this, a critique in a Wolf Street publication recently challenged the efficacy of the yield curve as a trustworthy predictor, igniting a debate worth considering.
The critique highlighted an instance where the US yield curve recently reverted to a more typical shape after having been inverted, raising questions about the veracity of the signals it sends concerning impending recessions. While it is accurate that this ‘uninversion’ occurred, the article inaccurately claimed that the yield curve’s predictive power has been flawed since 1998, citing two supposed instances where it falsely signaled recessions that did not come to pass.
One of the debated points was the 2019 inversion. Critics argue that the subsequent recession in 2020, spurred by the global COVID-19 pandemic, cannot be attributed to a cycle downturn in the business environment, thus attempting to undermine the yield curve’s successful forecast. However, this line of reasoning appears somewhat flawed. To deem the 2019 inversion a failure, one would need to demonstrate that, in the absence of the pandemic, a recession would not have ensued, a hypothesis that is both untestable and impractical. Therefore, the 2019 inversion should either be considered a successful prediction or simply an anomaly that falls outside the normal predictive scope due to unprecedented global circumstances.
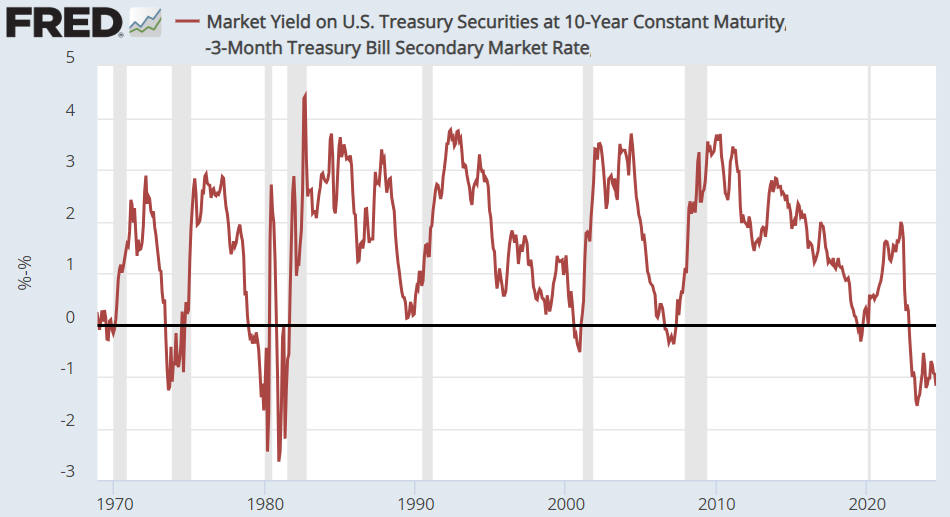
Furthermore, the article brings to light a yield curve inversion in 1998, which did not culminate in a recession. This assertion seems to overlook the intricate nuances involved in interpreting the yield curve. A temporary inversion, lasting just a few days, may not possess the same predictive capacity as more persistent trends. By evaluating the yield curve based on monthly averages or monthly closing figures, a practice generally adhered to when dealing with long-term indicators, the reliability of inversion signals greatly increases.
Historically, each instance of inversion between the late-1960s and the current cycle, when analyzed on a monthly chart, was succeeded by a recession, underscoring the yield curve’s predictive reliability over the past half-century. However, it’s worth noting that the anticipated recession following the yield curve inversion preceding the 1990 economic downturn did not materialize, presenting a rare case of a false negative.
The critique in Wolf Street also questioned the utility of the yield curve inversion/uninversion as a signal for trading, citing the protracted and inconsistent time span between the signal and the eventual economic outcome. Though it might not serve as a precise tool for short-term trading strategies, the historical pattern of the yield curve’s predictive successes and failures provides invaluable insights into the broader economic trends and potential recession forecast.
Understanding the yield curve’s function in economic forecasting requires a nuanced appreciation of historical context and the myriad factors influencing the economy. The curve itself represents the relationship between interest rates of short-term and long-term government bonds. Normally, long-term bonds offer higher returns compared to short-term bonds, reflecting the higher risk and uncertainty over a longer period. An inversion occurs when this relationship flips, signalling investor concern about the near-term economic outlook and a preference for the relative safety of long-term investments.
In the grand tapestry of economic indicators, the yield curve is but one thread interwoven with others, such as employment rates, consumer spending, and manufacturing activity, to form a broader picture of economic health. Its predictive capacity, while not infallible, has been borne out over decades, offering a critical lens through which to view potential future economic shifts.
The demographic of readers and investors who seek to understand the complexities of the yield curve and its implications on economic forecasting is vast. It includes those with a keen interest in financial markets and economic policy, as well as students of economics and professionals in related fields. By delving into the historical performance of the yield curve as a predictor and acknowledging its limitations, one can appreciate its role within the broader economic analysis sphere.
Therefore, while the yield curve inversion may not always provide a clear signal for immediate actions in trading or investment, its historical significance and the theoretical underpinnings that justify its predictive power cannot be overlooked. Its fluctuations offer insights, serving as a piece in the puzzle of economic forecasting, and remind us of the complexity of predicting future economic conditions in an interconnected global economy.


