


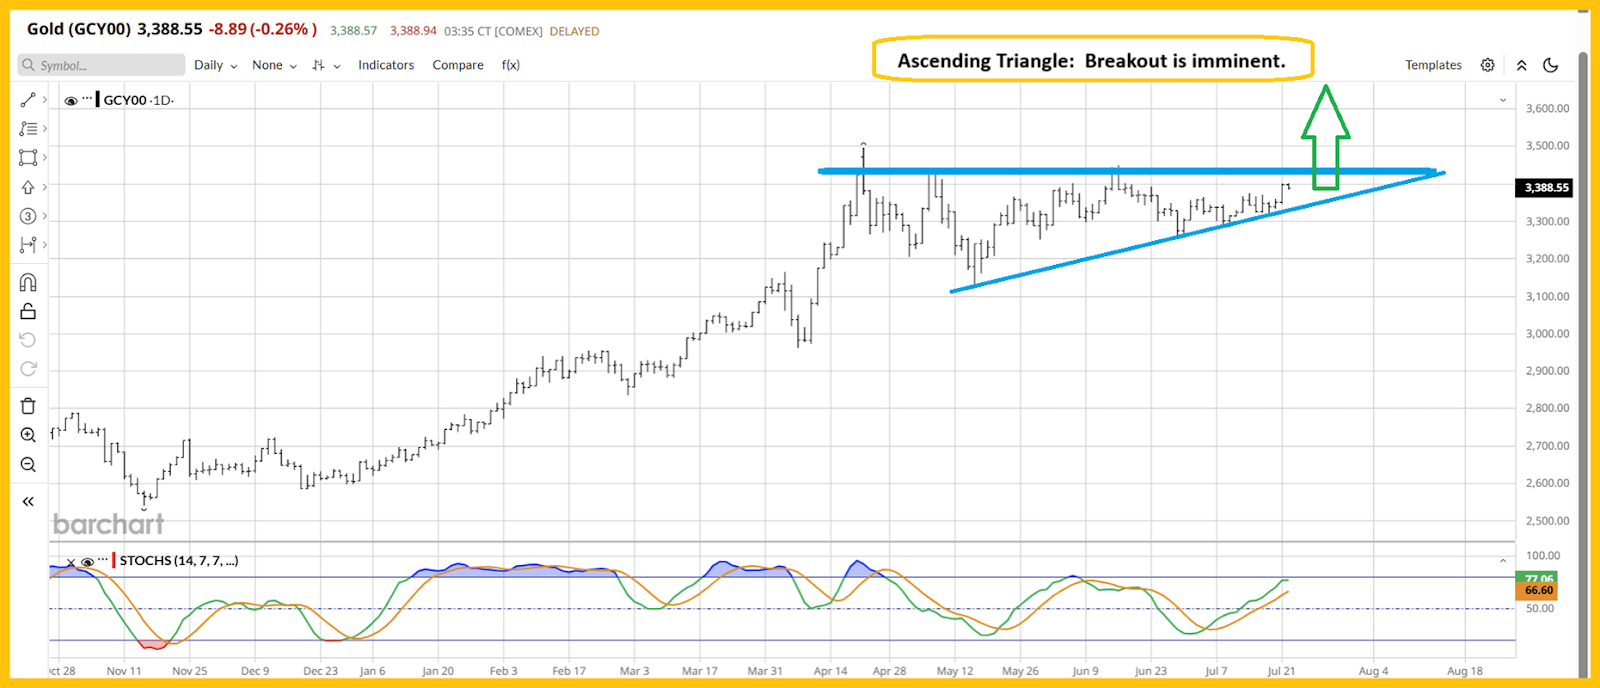
In the realm of precious metals, gold and silver appear to be on the brink of a significant rally, capturing the attention of investors and market analysts alike. The intrigue around these metals is particularly heightened by recent analysis of gold’s daily and weekly chart patterns, which hint at a potential surge in prices, possibly reaching an ambitious target of $3,800 for gold. This speculation is further bolstered by silver’s performance, which, if gold reaches its projected heights, is expected to revisit its historical peak of around $50.
Delving deeper into the technical analysis reveals an ascending triangle formation on the daily gold chart, suggesting a robust bullish signal. Meanwhile, the weekly gold chart corroborates this optimistic outlook by presenting a symmetrical triangle, both of which point towards the same exhilarating target of $3,800. This technical alignment across different time frames underscores the potency of the bullish sentiment underlying these predictions.
This bullish outlook is situated against the backdrop of mounting concerns over the United States’ substantial government debt. The government’s portrayal of this escalating debt as “big and beautiful” has sparked widespread astonishment and dismay, particularly among central banks and sovereign wealth funds worldwide. These entities, already in a state of alarm, are now hastening their efforts to diversify their portfolios by investing in gold and, potentially, silver as well. This trend of diversification, aimed at hedging against what they perceive as a cavalier attitude towards national debt, seems to be intensifying with each passing week.
Moreover, the current tariff policies implemented by the U.S. government, which aim to place tariffs on nearly all goods imported into the country, have introduced an additional layer of uncertainty. These policies, marked by numerous delays and cancellations, have investors and importers on edge, especially as significant tariff implementations loom on the horizon. The implications of these policies are not only concerning in terms of trade relations but also pose a risk of engendering stagflation, thereby exacerbating the existing economic challenges.
In this turbulent economic environment, the U.S. stock market finds itself at a precarious juncture. With the specter of “crash season” hovering between August and October, the market exhibits signs of vulnerability, underscored by a worrying divergence in volume accompanying recent fluctuations. The market’s stagnation over the past year, coupled with the impending threat of tariff-induced disruptions to corporate earnings and consumer prices, casts a shadow over the financial landscape.
Against this backdrop, the valuation of the U.S. stock market, as evidenced by the Shiller/CAPE ratio, presents a stark illustration of its overvaluation. Investors are increasingly in search of viable alternatives to hedge against potential downturns, mirroring historical precedents from 1966 and 1929 where similar conditions precipitated significant market corrections.
In search of more optimistic prospects, the CDNX weekly chart emerges as a beacon of hope. Serving as the ultimate emblem for the 40-year stagflation/deflation cycle, the CDNX chart signals the ushering in of a new era marked by inflationary pressures. Following the deflation cycle’s conclusion in 2020, the index has shown promising signs of recovery, hinting at a potentially lucrative phase for investors in CDNX component stocks.
Particularly noteworthy are the senior mining stocks, as represented by the GDX daily chart, which anticipate a ‘seasonal inversion’ event, potentially heralding a surge in these stocks between July and October. This bullish sentiment is mirrored in the GOAU ETF, where technical indicators, such as the Stochastics oscillator, suggest favorable conditions for a breakout.
Moreover, the long-term U.S. rates chart offers valuable historical parallels between the current economic climate and the inflation cycle of 1940–1980. During this period, gold stocks thrived as the traditional stock market faltered, providing a historical precedent for the divergent paths of gold investment and broader market trends.
Silver, too, takes center stage in this narrative of precious metal ascendancy. Leading gold since April, silver’s breakout from an ascending triangle formation in early June portends a deepening of this leadership role. The SIL ETF chart exemplifies this momentum, showcasing silver stocks’ breakout from a decade-long trading range, setting ambitious targets that could see values escalate significantly.
In conclusion, the confluence of technical indicators, geopolitical uncertainties, and historical parallels paints a compelling picture for the future of gold and silver investments. With the backdrop of increasing government debt, controversial tariff policies, and stock market vulnerabilities, precious metals stand out as a beacon of stability and potential profitability. As such, the stage is set for what could be an unprecedented era of prosperity for gold and silver markets, marked by significant returns for astute investors primed to capitalize on these unfolding dynamics.


