


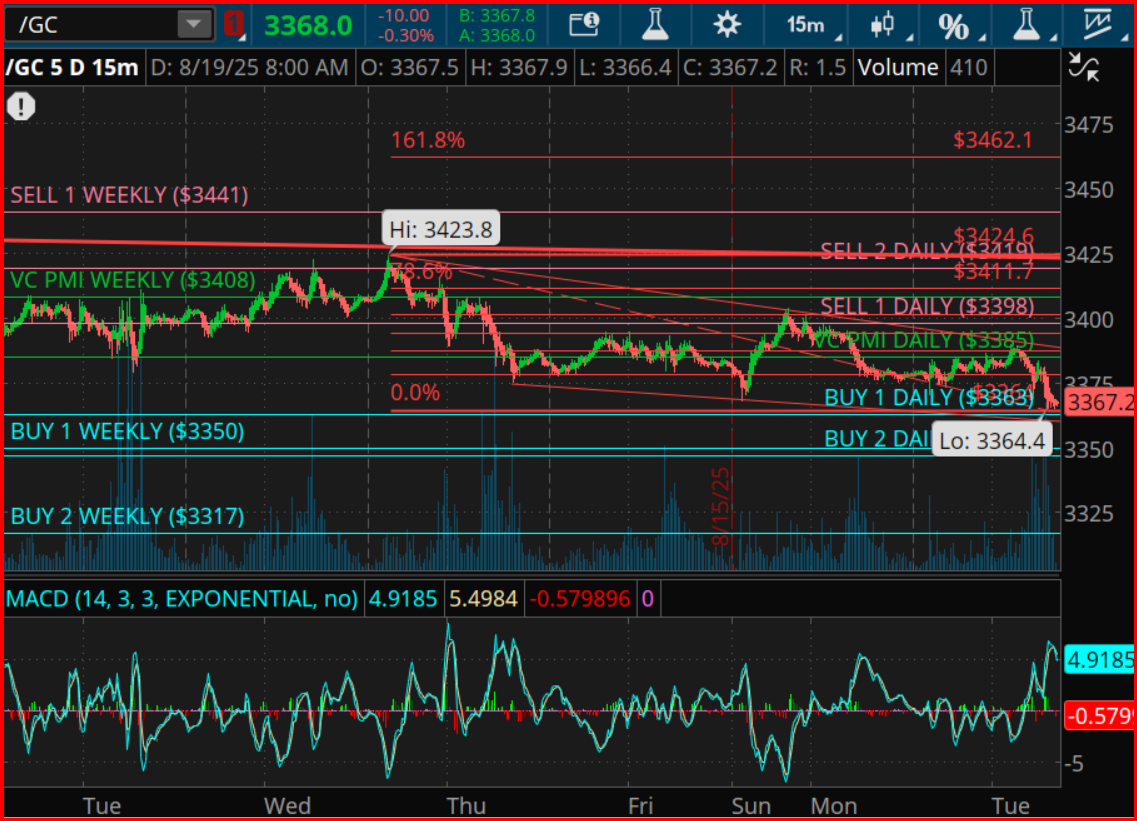
In the constantly evolving world of commodity trading, gold stands as a pillar of stability and a hedge against inflation for many investors. Its allure, derived from its historical significance and intrinsic value, has made it a focal point for those looking to diversify their portfolios. Currently, gold is witnessing a fascinating interplay of market forces, exemplified by its present trading position at $3,368.0. This marks a modest decline of 0.30% within the ongoing trading session, situating the precious metal intriguingly close to key support zones identified through the VC PMI methodology — particularly, the Daily Buy 1 ($3,363) and Weekly Buy 1 ($3,350) levels.
These specific zones are of particular interest due to their formation of a high-probability support cluster, suggesting that, statistically, endeavours to purchase gold are favoured here. It’s a nuance of the market’s structure that beckons traders looking for positions that align with statistical backing.
The journey of gold’s price further features a recent apex at $3,423.8, touching on the 78.6% Fibonacci retracement level, and heralding the entry into a robust resistance territory leading up to the Weekly Sell 1 ($3,441) marker and a Fibonacci extension target of $3,462.1. The emerging narrative is one of gold prices entangled within a constrained range between $3,363 support and $3,398 resistance, signaling a potential breakout on the horizon.
Understanding the delicacies of the gold market’s current dynamics entails a deeper dive into the VC PMI approach, coupled with Gann Time Cycle Analysis. The former marries daily and weekly trading insights, encapsulated in zones ranging from Daily Buy 1 and 2 ($3,363 and $3,340 respectively) for buying opportunities, to Daily and Weekly Sell thresholds ($3,398 and $3,441) that mark potential exit points or short entries for traders.
In tandem, the Gann Time Cycle Analysis, starting from a significant turning point on September 28, 2024, projects a 360-day cycle encompassing varying degrees of market movements. Key dates include the end of December 2024, marking a 90° quarter-cycle anticipated to signal a minor trough and the onset of a rally — leading up to a full cycle completion on September 28, 2025, which is posited as the next major pivot window and a projected cycle low.
Harmonics also play a critical role within this analytical framework. Employing the Square of 9 principles from the pivotal September 28, 2024, low, it delineates critical levels like $3,363 as a natural reversal zone aligning with a 90° rotation, and the range between $3,408 to $3,441, corresponding to the 180° harmonics, as a cluster that might act as both a magnet and resistance.
Momentum, a cardinal gauge of market sentiment, captured through tools like the MACD line and signal line, further nuances the current market disposition with evidence of a bearish divergence, hinting at possible short-term downward pressures. Yet, an extended oscillator could signal impending reversal, potentially catalysing a swift rally towards the mean as earmarked by the VC PMI at $3,408.
Looking ahead, the prospects for gold pivot on its ability to maintain above the critical support juncture of $3,350–$3,363. Should this hold, a mean reversion to $3,408 is plausible, before a further climb towards $3,421–$3,441. On the flip side, a breach below these supports exposes deeper fallback levels at $3,340 (Daily Buy 2) and $3,317 (Weekly Buy 2), potentially heralding the final descent in the underlying 360-day cycle towards a significant low in late September 2025.
The strategic trading landscape, therefore, unravels into two primary narratives: a long setup that leverages the $3,350–$3,363 bracket for entry, with sights set on sequential targets upwards; and a short setup that could activate near the $3,421–$3,441 area, in anticipation of cycle-induced downward momentum, with objectives set at descending levels.
In summary, gold finds itself at a pivotal threshold where the interplay of bullish and bearish forces is acutely balanced. The ability for the precious metal to sustain above the $3,350–$3,363 spectrum signals a potential for a rally to higher resistance zones before the forecasted September cycle trough manifests. As the market moves, it does so with the weight of history, the scrutiny of traders, and the anticipative gaze of investors, all converging on this ancient asset that continues to captivate and confound.
Please note, trading in derivatives, financial instruments, and precious metals carries a significant risk of loss and is not suited for every investor. Past performance does not necessarily predict future results, and all trading involves a level of risk that should be fully understood before participation.


