


In the realm of financial markets, the focus frequently shifts to precious metals, owing to both their historical significance and their contemporary relevance as hedging tools against inflation and geopolitical uncertainties. Over recent days, attention has gravitated towards these venerable assets, particularly as global events and economic policies weave an intricate dance that influences their valuation. One of the most compelling developments in this narrative has been the significant fluctuation observed in the price of gold following the conclusion of tariff agreements between the United States and Japan.
In days preceding this event, gold, alongside other precious metals such as Silver and Palladium, had been on an upward trajectory, benefiting from a weakening US dollar. Investors often flock to gold as a safe haven when the dollar depreciates, making it cheaper for holders of other currencies to purchase this asset, thereby driving up its price. However, in a dramatic turn of events, the mood amongst traders has considerably shifted in response to these new trade accords. The anticipation of positive advancements in global trade has reintroduced a level of optimism that had been conspicuously absent, resulting in notable selling pressure on gold, although Silver and Palladium have maintained their upward momentum.
Platinum and Gold, however, have faced a challenging trading environment, grappling to find footing amid these turbulent conditions. This divergence within the precious metals market underscores the complex interplay of factors that influence asset prices, ranging from macroeconomic policies to sentiment-driven trading.
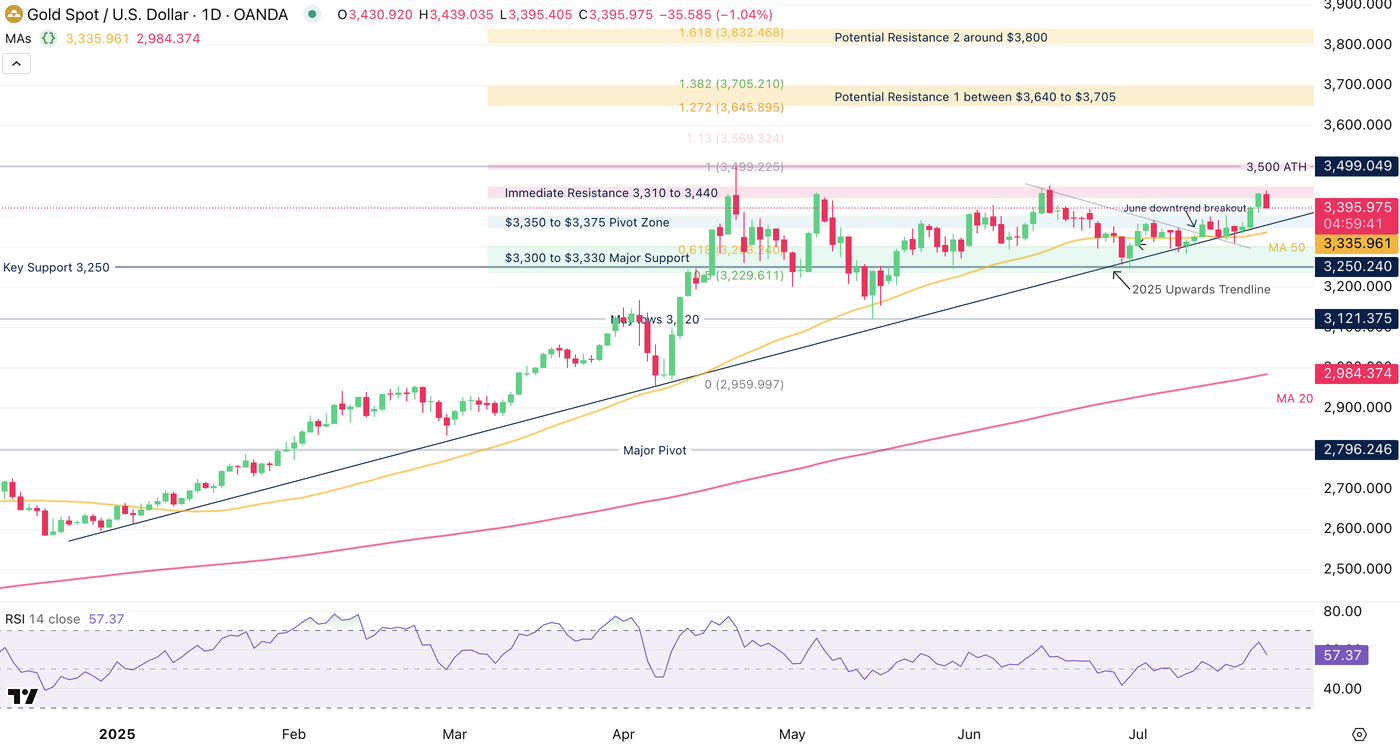
To gain a deeper understanding of gold’s market dynamics, it is essential to delve into a multi-timeframe technical analysis, which permits a nuanced exploration of potential entry and exit points, thereby equipping investors with a strategic advantage. Succinctly, starting from a daily chart perspective, though gold has exhibited several minor recoveries, characterized by small-scale bounces off an upward trendline since 2025, the overall price movement has remained largely rangebound. Despite these fluctuations, the inability to consistently breach key resistance levels signals a lack of momentum for a rally towards historical peaks, such as the $3,500 mark.
Yet, this is not to imply that gold’s outlook is wholly pessimistic. The resilience of these bounces suggests undercurrents of strength, with bullish sentiments prevailing so long as the metal sustains above the critical $3,350 Pivot Zone. These observations lay the foundation for identifying strategic support and resistance levels integral to crafting informed trading decisions. Among these, support levels at $3,350 to $3,375, followed by the 50-Day Moving Average at $3,335 and more robust support spanning $3,300 to $3,330, offer vital cushions. Moreover, the psychological threshold of $3,000 serves as a longer-term bulwark against bearish tides.
Conversely, resistance levels demand equal scrutiny, with immediate barriers lying between $3,410 to $3,440 and the pinnacle at $3,500, representing historical highs. Should gold embark on an ascendent trajectory, potential resistance as delineated by Fibonacci extensions could coalesce between $3,640 to $3,705, extending up to around $3,800, heralding zones of contention for bullish momentum.
Zooming in further to a 4-hour chart reveals the immediacy of market reactions, with a pronounced bear candle manifesting in the wake of the US-Japan tariff negotiations, thus resetting the Relative Strength Index (RSI) momentum to a neutral stance. Despite the vigor of recent days, the established range maintains its grip, awaiting a decisive breakout.
Narrowing our lens to a 30-minute chart provides an even more granulated view of intraday dynamics. The ongoing selloff encounters a semblance of support along an upward intraday trendline stemming from the most recent swing low. This delicate balance between the dual forces of buying and selling is further demarcated by the key 30-minute Moving Averages, with the 50-period MA posing as resistance at $3,423 and the 200-period MA providing immediate support at $3,378.
In encapsulation, this intricate examination of gold through multiple temporal lenses underscores the fluctuating fortunes of this timeless asset amid evolving economic landscapes. As trade agreements like those between the US and Japan reshape market sentiments, the importance of vigilant, informed trading strategies becomes ever more pronounced. For enthusiasts and investors alike, tracking these shifts offers not only a glimpse into the heart of global finance but also the opportunity to navigate the ebbs and flows of a market in constant motion. Safe trades to all!


