


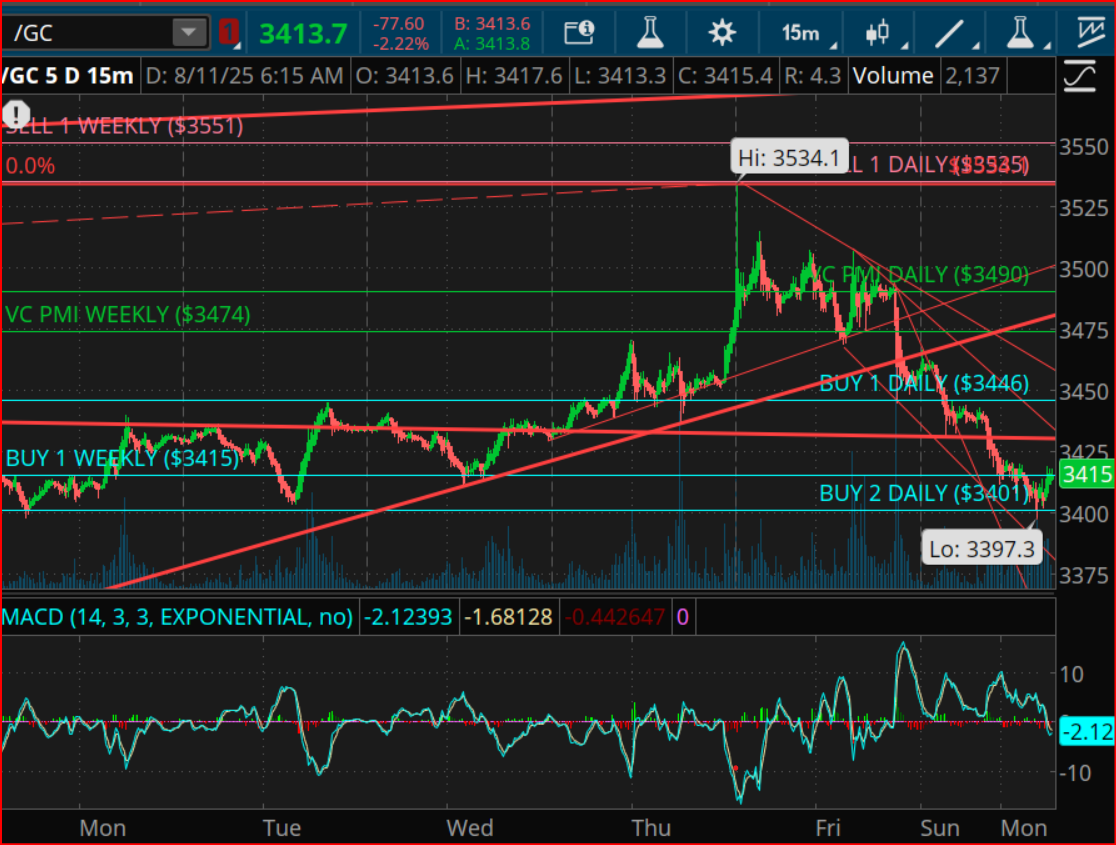
As the latest week of trading commenced, the gold market found itself grappling with an onslaught of selling pressure, a drastic shift from the rapid ascent that had culminated at $3,534.1 on the preceding Friday. This development is of paramount importance as it intersects with both Daily and Weekly Buy 1 support levels at $3,415, positioning it as a critical juncture wherein daily and weekly indicators converge.
At the moment, the market for gold is perched at a crucial crossroads. It is a place where a double confluence of VC (Variable Changing Price Momentum Indicator) PMI and Gann levels are poised to steer the market’s direction in the ensuing 48 hours. The onset of selling pressure was marked when gold prices faltered at sustaining above the VC PMI Daily pivot of $3,490, initiating a downward spiral that breached the Daily Buy 1 support level at $3,446. Presently, the market is tentatively balanced just above the Daily Buy 2 zone at $3,401.
This zone commands attention due to its alignment with the Weekly Buy 1 support, creating a dual daily-weekly confluence area. In the realm of VC PMI levels, such alignments have historically served as pivotal moments. They often act as the fulcrum for either a sharp counter-trend recovery or, should the level be compromised, a gateway to extended downward momentum.
From the perspective of Gann analysis, a discipline that combines geometry, astrology, and ancient mathematics to predict market movements, the peak observed last week aligns with a minor cycle’s crest. This could indicate that the market is currently navigating the descending phase of a cycle, potentially leading to a late-summer or early-autumn cyclical trough – if the 360-day cycle structure holds true.
The application of Square of 9 price mapping further delineates $3,401 as a significant mathematical level, intricately linked to the recent high of $3,534. A breach of this support zone could swiftly pave the way to the next vibrational levels delineated by the Square of 9, specifically $3,374–$3,355.
Momentum indicators reinforce the bearish outlook, with the MACD (Moving Average Convergence Divergence) posting a reading of -2.12 and the histogram entrenched in bearish territory. The heightened volume amidst the sell-off underscores the pervasive nature of the liquidation, suggesting it is not merely attributable to a passive buyer retreat but rather an active seller incursion.
Should market participants muster the resilience to hold the $3,401–$3,415 band and manoeuvre prices back towards the Daily VC PMI at $3,490, it could signify the commencement of a mean reversion process. Conversely, a failure to maintain this ground could hasten the decline, with attention then shifting towards deeper cycle-based support levels.
In essence, gold currently finds itself engaged in a tactical showdown, influenced by the dual forces of VC PMI and Gann levels. The outcome of this standoff is eagerly anticipated, with the potential to shape the market dynamics over the next couple of days.
—
It is crucial for market participants to remember that trading derivatives, financial instruments, and precious metals carries a significant risk of loss and may not be suitable for all investors. Furthermore, past performance does not serve as a reliable indicator of future results. This underscores the inherent volatility and unpredictability of financial markets, emphasizing the need for caution, thorough analysis, and an informed approach to trading and investment decisions.


