


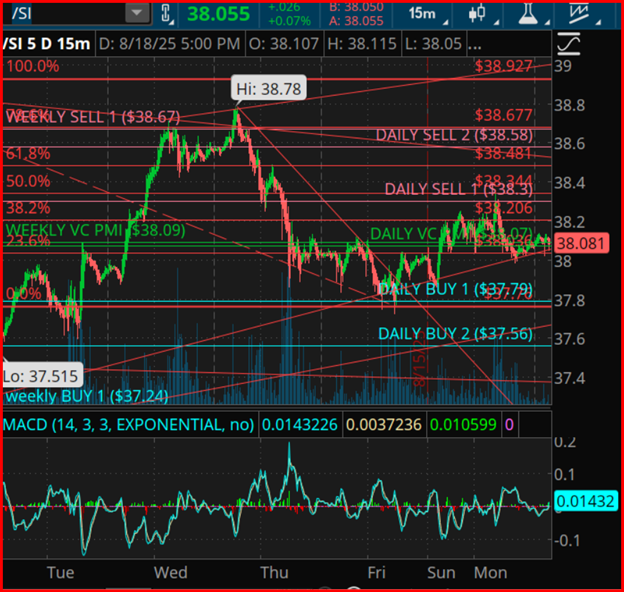
In the constantly fluctuating world of financial markets, the trading of commodities such as silver offers intriguing insights into investor behavior, risk management, and economic indicators. Presently, silver finds itself at a notable juncture, trading at approximately $38.055. This pricing reflects recent market activities where it has oscillated between a high of $38.78 and a low of $37.515. This period of volatility has seen silver’s price gravitating around equilibrium points, known as the VC PMI mean zones, as well as the critical 61.8% Fibonacci retracement level at $38.07. This convergence signals a pivotal balance point in the market, offering a fascinating glimpse into the technical analysis that underpins commodity trading.
The Value Channel Price Momentum Indicator (VC PMI) plays a pivotal role in understanding the current market dynamics of silver. A remarkably adaptable indicator, the VC PMI takes a neutral stance at $38.07 for daily assessments and $38.09 for weekly evaluations, showcasing a market in equilibrium. This delicate balance sets the stage for potential shifts as traders watch resistance and support levels with keen interest. Immediate resistance—or sell zones—hover at daily levels of $38.34 and $38.58, with a weekly high at $38.67. Conversely, support—or buy zones—are seen at $37.79 and $37.56 for daily evaluations and $37.24 for weekly insights.
The significance of these levels becomes apparent when considering the broader context—the Gann 360-day cycle progression. The foundational anchor date, September 28, 2024, marks a significant low, with the cycle evolving through quarters that dictate minor pivots, mid-cycle tops, secondary lows, and culminating in a projected major low by September 28, 2025. As we traverse the final quadrant of this cycle, market volatility is expected to intensify, marking a distribution and topping phase before the cycle concludes.
The synchronization of these cycles with harmonic levels and the Square of 9 theory — a method used by traders to predict financial market movements based on geometry and natural mathematics — reveals a near-term balance point at $38.07. This point correlates with a 61.8% retracement and a 90° rotation from the $37.51 low. The interplay of these elements suggests an imminent sharp market movement, shaping the outlook for silver in the coming weeks.
Analysts have put forth several scenarios based on these technical indicators, assigning probabilities to each. A bullish scenario, with a 35% likelihood, foresees prices breaching the $38.34 to $38.58 resistance zone, potentially rallying towards $38.92. A neutral or balanced scenario, deemed 20% likely, envisages prices coiling around the $38.07 marker until market forces reach a resolution. Conversely, the bearish scenario, with a 45% probability, predicts that prices dipping below the $37.79 to $37.24 support range could signal a decline phase aligning with the September 28, 2025, cycle low forecast.
This analysis not only delves into the intricacies of silver trading but also offers a broader narrative about the cycles that govern financial markets. Understanding these patterns and technical indicators can provide traders and investors with crucial insights into market trends, risk management, and potential investment strategies. However, it’s paramount to recognize that trading derivatives, financial instruments, and precious metals involves significant risks. Past performance, while informative, is not always indicative of future results.
In conclusion, silver’s current trading dynamic encapsulates the complex interplay of supply, demand, investor sentiment, and technical indicators that drive commodity markets. As we approach key milestones in the Gann 360-day cycle, market participants should brace for increased volatility, with potential for both risk and reward in the evolving narrative of silver futures. Navigating this terrain will require not only a keen understanding of the historical and technical context but also a measured approach to market speculation and investment.


