


In an astonishing turn of events, the US economy has managed to stave off a recession for the past two years. This unexpected resilience, however, doesn’t signal that the economy has completely evaded the typical downturns associated with recessionary periods. Rather, it indicates that the current economic cycle has stretched beyond its usual timeline.
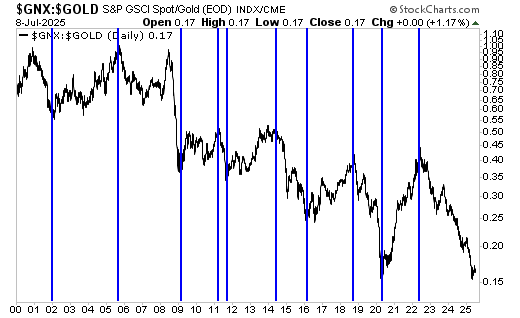
To understand the dynamics of economic fluctuations, particularly the ebb and flow between booms and busts, financial analysts often turn to the commodity/gold ratio. This ratio, calculated by dividing the Spot Commodity Index (GNX) or the CRB Index (CRB) by the US dollar gold price, serves as a barometer for gauging the overall health and trajectory of the economy. In essence, a rising commodity/gold ratio over a multi-year span denotes a period of economic boom, while a declining ratio heralds a bust phase.
Observations from the GNX/gold chart, which has been annotated with vertical lines to highlight the shifts in economic trends since the year 2000, offer a compelling visual narrative of these cycles. Although it’s not a hard and fast rule that a bust must culminate in a recession, historical patterns suggest it’s a rare occurrence for a bust phase to end without the economy passing through a downturn. The typical sequence unfolds as follows: the commodity/gold ratio begins its descent, signalling the onset of a bust; the economic downturn then intensifies until it meets the criteria for a recession; and, finally, as the recession draws to a close, the commodity/gold ratio reverses its trend upwards, indicating the dawn of a new boom.
One might assume that the stock market would mirror these economic phases closely, but in practice, the relationship isn’t so straightforward. For example, even after a bust began in October 2018, the stock market continued to reach new heights into early 2020. A similar pattern occurred during the early 1970s, where the market ascended for three years following the initiation of a bust phase.
The current dynamics of the stock market further muddle this relationship. The prevalence of passive investing strategies has transformed how the market responds to underlying economic indicators. Rather than acting as a predictor of cyclical trends in corporate earnings, interest rates, or economic growth, the stock market now seems to be more influenced by passive money flows. This shift raises the possibility that the next cyclical peak in the S&P 500 could occur after a recession has already begun, a departure from historical norms.
The unfolding situation bears a striking resemblance to the 1970s, a decade marked by prolonged bust phases intertwined with concerns over inflation as a dominant economic challenge. The commodity/gold ratio has been on a downward trend since the first half of 2022, placing the US economy in a prolonged bust phase. Remarkably, this has occurred without the economy tipping into a recession – a scenario that aligns with the patterns observed during the 1970s but stands in stark contrast to the more succinct cycles of recent decades.
Taking a broader view through a monthly chart of the commodity/gold ratio, which transitions from the CRB Index to the GNX post-1993, further accentuates this comparison. Both major bust periods of the 1970s (one commencing in Q1-1970 and another in Q3-1976) preceded recessions by approximately 3.5 years – the first leading to a recession in November 1973, and the second in January 1980. With the current cycle approximating this 3.5-year timeline from bust to recession, it suggests that, while the economic rhythms have expanded, they echo the historical interplay between inflation concerns and economic activity.
Thus, in the context of temporal shifts and evolving market dynamics, the current state of the US economy presents a fascinating study of resilience amid adversity. Yet, it also heralds a future where past patterns may not offer a perfect roadmap, underscoring the complexities of navigating economic cycles in an ever-changing financial landscape.


