


In the intricate world of global finance, the lustre of gold often reflects the underlying tremors of international politics and economic policies. The gleaming metal, typically a beacon of stability in tumultuous times, found itself navigating through choppy waters as it slipped beneath a crucial technical formation known as the symmetrical triangle. This occurred in the wake of a significant trade agreement between the United States and the European Union, marking a pivotal moment that could reshape the landscape of international trade.
The inception of the trading week saw gold taking a notable downturn, opening at 3,319, a gap lower than its previous stance. This sudden dip was primarily spurred by the weekend revelation that the European Union had conceded to the imposition of 15% tariffs on US imports. This move was a compromise, halving the initially touted tariffs by then-President Donald Trump, which exemplifies the complexities and negotiations inherent in international trade agreements.
The essence of the US-EU trade deal not only involves tariffs but also sees the European bloc committing to significant investments in the American energy and military sectors. What is more, the EU agreed to this without setting forth any retaliatory tariffs, a measure typically expected in trade negotiations. Noteworthy is the decision to maintain the 50% tariffs on steel and aluminum, underscoring the selective nature of this agreement and its potential ripple effects on various sectors.
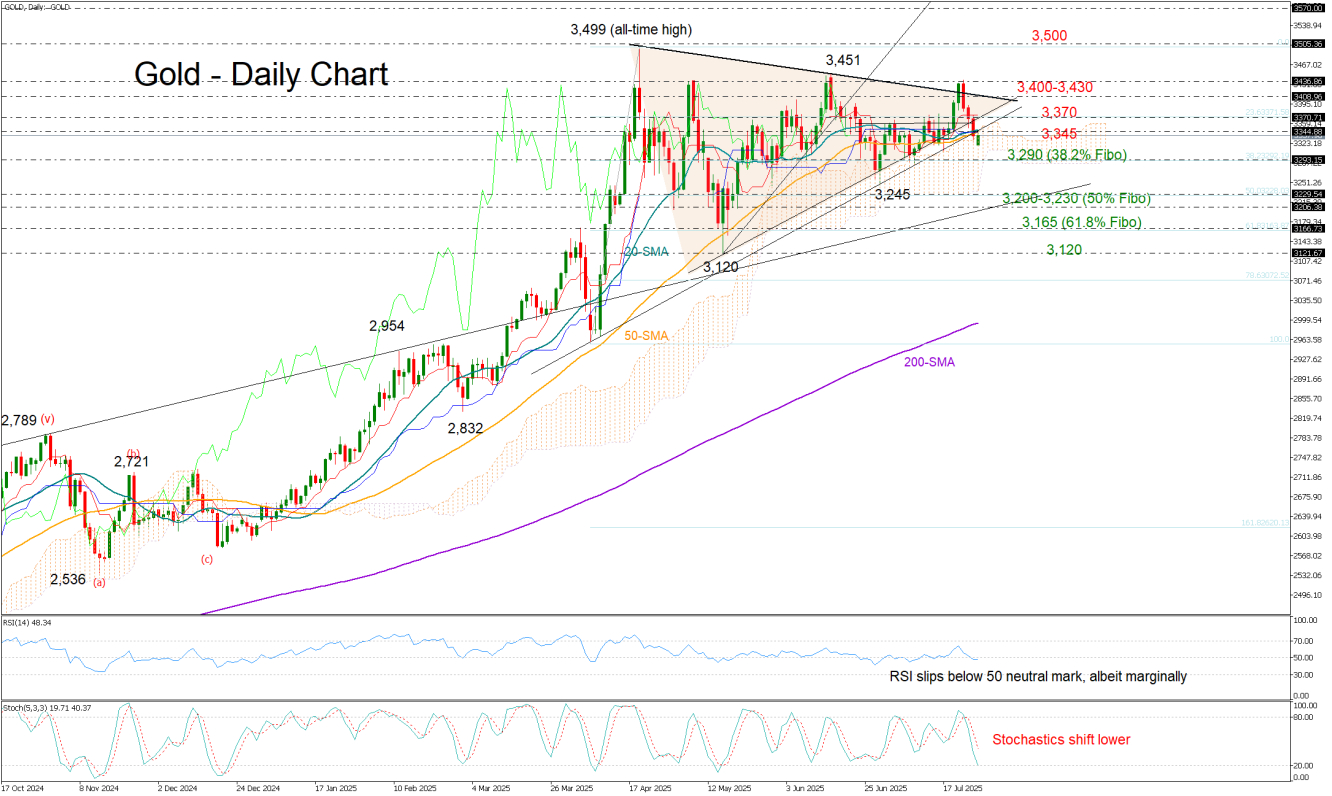
From a technical analysis standpoint, the recent performance of gold signals a potential shift in market sentiment. The falling below the symmetrical triangle, alongside indicators such as the short-term Simple Moving Averages (SMAs) and the Ichimoku cloud, paints a bearish scenario. Technical indicators further cement this viewpoint, with the Relative Strength Index (RSI) breaching the neutral 50 threshold and the stochastic oscillator trending downwards, suggesting that the path of least resistance might be downward – especially if gold fails to breach the resistance level near 3,345.
Should this bearish momentum persist, the initial target might be the 38.2% Fibonacci retracement level of the April upsurge, situated around 3,290. A deeper descent could be somewhat tempered by the confluence of the 50% Fibonacci level at 3,230 and a critical support zone hovering near 3,200. Yet, only a definitive drop below the 61.8% Fibonacci retracement level of 3,165 would crystallise a trend reversal in the broader context.
Conversely, a resurgence above the 3,345–3,370 range could potentially rekindle buyer interest. However, a sustained break above the triangle’s upper boundary near 3,400, followed by overcoming last week’s resistance level at 3,430, would be crucial to igniting a more rapid ascent toward the paramount 3,500 mark.
This development in gold’s journey underscores the intimate correlation between geopolitical events and commodity markets. The agreement between the EU and the US is emblematic of how international diplomacy and economic policies can directly influence market dynamics, including those of safe-haven assets like gold. The fluctuations observed reflect not only the immediate reactions of traders to news developments but also the broader uncertainties that permeate global financial markets.
As gold hovers at the brink of potential bearish reversal, market participants will closely monitor these dynamics, understanding that beneath the surface of such movements lie intricate stories of international negotiation, economic policy, and the perpetual balancing act between risk and stability in a world that remains unpredictable. The narrative of gold in this context serves as a mirror reflecting the multifaceted impacts of global events on financial markets, providing valuable insights into the complexities of our interconnected world.


