


In the dynamic landscape of global finance, the precious metal market, particularly gold, often serves as a litmus test for investor sentiment and economic stability. As of Monday, the value of gold stabilized at $3,330 per troy ounce, following a sequence of three days marked by a decrease in its value. This pattern of stability emerged in the wake of damped enthusiasm for safe-haven assets, triggered by a significant development in international trade relations.
The crux of this shift in investor sentiment was the announcement of a comprehensive trade agreement between the United States and the European Union. This deal, confirmed on Sunday, proposes a 15% tariff imposition on the majority of goods exported from Europe to the United States. Accompanying this tariff strategy is a pledge to channel hundreds of billions of dollars into bolstering American industries. This trade agreement echoes the framework of a previously established pact between the United States and Japan, highlighting a tactical approach by the US to negotiate trade terms that may reshuffle the global economic order.
In the realm of finance, traders are steeling themselves for a week teeming with significant economic milestones, with the spotlight fixed on the upcoming Federal Reserve meeting. Although changes in interest rates are not anticipated, the market is poised to decipher any hints of a possible rate reduction in September. Furthermore, the focal points will include critical data from the US labor market among which are employment figures, wage growth statistics, and the all-important nonfarm payroll report. Another key indicator due to be released is the Personal Consumption Expenditures Price Index (PCE), the Federal Reserve’s preferred metric for inflation, which could shed light on the inflationary impact of the newly introduced tariffs.
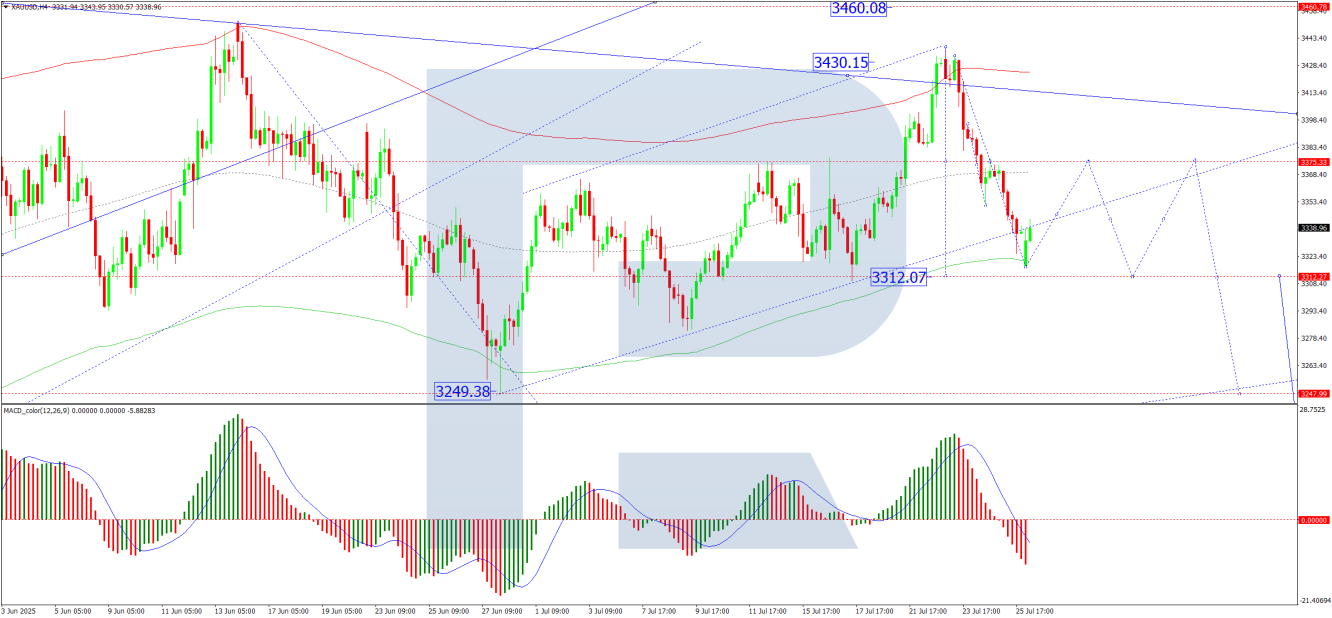
Diving into the technical analysis of gold prices, particularly in the XAU/USD currency pair, presents an intriguing perspective on market movements. The four-hour chart reveals that the price has been oscillating within a broad consolidation range, reaching a local low before anticipation of a corrective upward movement. Following this potential rebound, expectations lean towards a subsequent decline. This projection is based on the analysis of the Moving Average Convergence Divergence (MACD) indicator, which signals a downward trajectory with its line positioned below the zero mark.
In greater granularity, examining the hourly chart for XAU/USD solidifies the inference of forthcoming volatility. After achieving a local decrease, there is potential for a short-lived upward momentum towards the upper bounds of the current range. Should this consolidation occur, there exists a possibility for an ensuing dip. Corroborated by the Stochastic oscillator’s upward trend towards the higher spectrum, the market’s direction appears prone to swift changes.
In conclusion, the intersection of global trade developments and forthcoming economic data releases from the United States casts a shadow of uncertainty over the future movements of gold prices. The dual influence of geopolitical dynamics and domestic economic indicators suggests that investors and traders must remain vigilant. As this complex narrative unfolds, the ability to interpret and react to these multifaceted drivers will be paramount in navigating the volatility that lies ahead.
It’s worth noting that the insights and forecasts provided herein are derived from the analytical prowess of financial experts, yet they embody a perspective that should not be construed as direct trading advice. Entities or individuals, such as RoboForex’s Analytical Department, which offer such analysis, understandably disclaim responsibility for the trading outcomes that may ensue from basing decisions on their published perspectives. As always in the unpredictable arena of financial trading, diligence, and thorough analysis remain the best guides for navigating market fluctuations.


