


In the intricate world of commodities trading, the dance of gold prices over a short period can reveal patterns that are both fascinating and indicative of future movements. Over the past five days, an analysis of the 15-minute chart unveils a classic example of mean reversion, a concept that captures the eye of both seasoned and novice traders alike. This pattern is not only appreciated for its occurrence in price fluctuations but also for its alignment with specific temporal symmetries that traders heavily rely on.
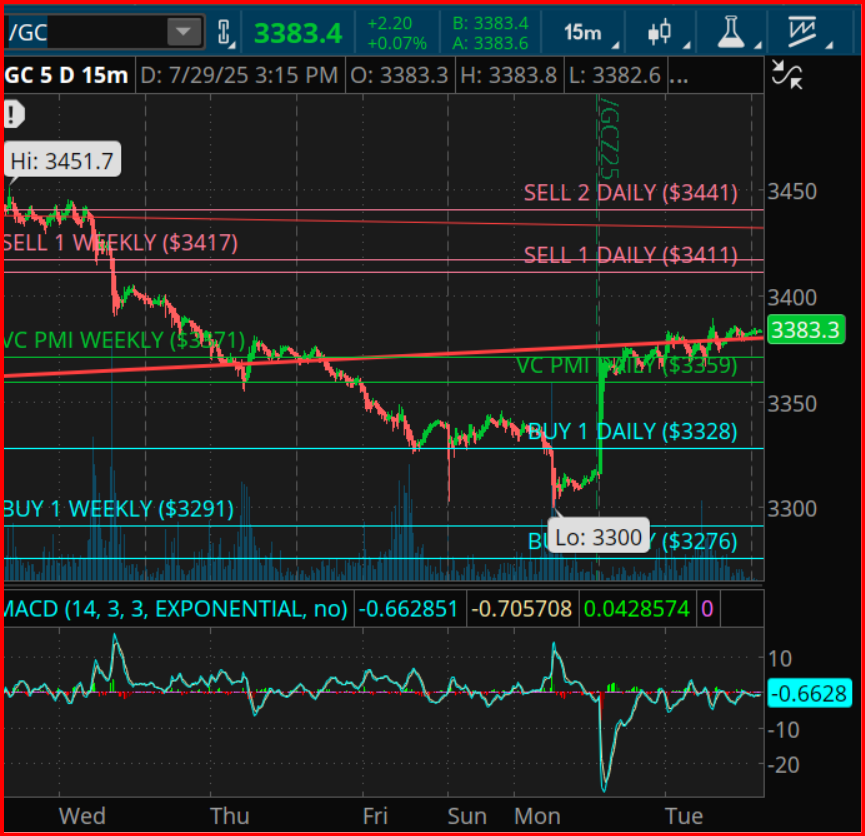
Let’s delve deeper into the recent behaviour of gold prices. Just last week, gold reached a peak price of $3,451.7. However, this zenith was shortly followed by a precipitous correction, resulting in gold prices bottoming out at exactly $3,300 at the onset of Monday. It’s intriguing to note that this trough wasn’t merely coincidental. It corresponded precisely with the Buy 1 Weekly level of $3,291 while also marking the end of a three-day Gann downcycle. This pattern, known for its harmonic retracement properties, is a testament to the predictive potential found within Gann’s Rule of Three, a methodology that has guided traders through the volatility of markets for decades.
From the nadir of $3,300, gold embarked on a noticeable reversal. It not only surpassed the Buy 1 Daily level of $3,328 but also cleaved through the VC PMI Daily pivot at $3,359. Its journey didn’t stop there; gold prices managed to steady themselves above the VC PMI Weekly pivot of $3,371. This progression above a critical pivot point is a strong signal of burgeoning bullish momentum within the market.
This brings us to an interesting piece of geometrical analysis – the Square of 9. In this framework, the rally from the $3,300 mark aligns perfectly with a 90-degree angle around $3,371, lending further credence to the significance of this particular price level. It resonates with key principles of both Gann analysis and VC PMI strategies. Furthermore, if we extend our harmonic examination to 180 degrees from $3,300, we encounter another intriguing price point of $3,441, a figure that aligns seamlessly with the Sell 2 Daily level. This convergence crafts a natural target zone and acts as a resistance level worth vigilance.
Looking forward, projections rooted in Gann’s time analysis suggest a potential cycle high might emerge between July 31st and August 1st. This prediction frames a 90-degree time square from the low witnessed in early July, presenting a critical window where traders may expect a temporary plateau or reactionary shift in gold prices, especially if they flirt with the $3,411–$3,441 resistance band.
Adding another layer of complexity, the Market Average Convergence Divergence (MACD) momentum is on the rise, showcasing a bullish crossover from previously oversold conditions. This trend underpins the notion that the recent reversal in gold prices is supported by substantial internal market dynamics.
To encapsulate, the journey of gold prices from the $3,300 low spotlights a pivotal confluence zone, as defined by Gann and VC PMI analyses. This juncture marks the threshold of an ascending trajectory for gold, projecting a potential advance towards $3,441. Nevertheless, as we journey towards the latter part of the week, it’s imperative for traders and investors alike to keep a close watch on price action. The impending Gann time window could unveil resistance patterns, offering pivotal insights for those navigating the ebbs and flows of the gold market.
This detailed exploration into the movements of gold prices over the past week underscores the significance of applying historical and mathematical analyses to understand and predict market trends. It echoes the myriad ways traders harness the legacy of W.D. Gann’s theories, intertwined with modern financial instruments like the VC PMI, to navigate the complex and often unpredictable realm of commodities trading. As market participants look to the horizon, armed with a blend of analysis and anticipation, the dance of gold continues, a testament to the enduring allure and mystery of commodities markets worldwide.


