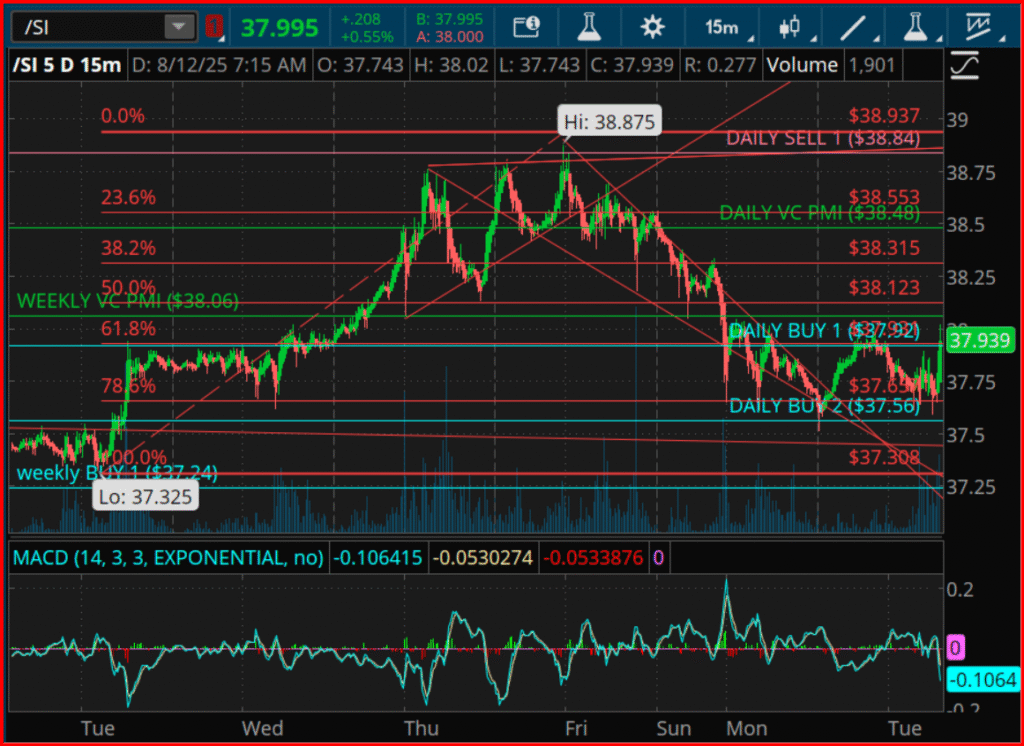
In the intricate tapestry of the financial markets, the trading constitution of various assets often circumnavigates through critical junctures, influenced by a myriad of factors including time and price geometry. Of particular interest in this regard is the commodity market, with silver being at the forefront of a dynamic shift that merits a deeper examination. The culmination of time and price geometry has ushered in a scenario that historical precedents suggest could lead to heightened market activity – a scenario we’ve recently witnessed.
The surge in silver prices to 38.875 towards the tail-end of last week was not merely coincidental but a consequence of an alignment with a Gann square angle upon the Square of 9. This occurrence signals that not only has the market reached a zenith that is significant in both its pricing and temporal dimensions, but it also inaugurates a phase where the market’s momentum shifts from an upward trajectory to a more methodical retracement. This retracement beckoned prices into a daily buy zone demarcated between 37.92 and 37.56, a range emboldened by the principles of Fibonacci retracements and VC PMI probabilities.
Such retracements, especially following a pivot that aligns with the revered Gann geometry, often set the stage for substantial market movements. The repositioning by largescale operators at this juncture is usually indicative of preparation for an ensuing movement in pricing. Noticeably, the Market Analysis Cumulation/Divergence (MACD) index, despite being situated in the negative at -0.1064, showcased a plateauing motion, hinting at a diminishing selling pressure which could potentially earmark the resurgence of bullish momentum.
The Phenomenon of Time in Gann Analysis
The realm of Gann analysis introduces an intriguing perspective where time is often considered a precursor to price movements. Utilizing the August 8th peak of 38.875 as a baseline, the application of Fibonacci-derived day counts yields projected pivotal junctures in the market’s trajectory. These range from a 1-day cycle pinpointing an initial reaction, to a 13-day cycle indicating a significant trend inflection in Gann’s lexicon. Particularly noteworthy is the cluster between the 14th and 15th of August. This period is marked by a confluence of time symmetry and the proximity to potential price breakout levels, presenting an enticing prospect for market movements.
Price Geometry through the Lens of Square of 9
The Square of 9 framework provides a geometrical lens to forecast price targets stemming from pivotal highs, in this case, the 38.875 marker. According to this methodology, subsequent targets unfold at specified degrees, with each marker serving as a potential springboard or checkpoint for price movements. Historically, surpassing a 45° projection level catalyzes a swift ascend towards the 90° marker, post-which a momentum evaluation occurs.
An Interwoven Nexus – The Symbiosis of Time and Price
The interleaving of time and price into a single narrative suggests that if silver sustains a position above 38.06 (the weekly VC PMI) ahead of the 14–15 August window, an upward trajectory towards the 38.48–38.84 range is plausible, with aspirations for further ascendancy towards the 40.45 mark, as delineated by the Square of 9. This paradigm corroborates with the impending Gann window of early August 15, wherein time and price may coalesce, potentially catalyzing a vertical rally.
Conversely, should silver retract below 37.92, permeating through the 37.56 threshold, a reevaluation towards the 37.30 mark might ensue, placing the Gann window of August 15 in a different light, one of downside reversal rather than an upside breakout. In such a scenario, the principle of downward symmetry within the Square of 9 would come to the forefront, eyeing price levels below 37.
Strategic Insights
As the market meanders through a phase of compression, energy is being concurrently stored within the domains of time and price geometry, poised for eventual release. The forthcoming Aug 14–15 cycle cluster emerges as a pivotal threshold. A market closing above 38.06 in the lead-up to this window distinctly amplifies the prospects of an upward breakout towards 40.45. Conversely, an inability to maintain above 37.92 could foreshadow a phase of deeper consolidation and potentially postpone the anticipated breakout into the Aug 20 or Aug 25 cycles.
Caveat
It is imperative to recognize that trading in derivatives, financial instruments, and precious metals involves substantial risk of loss and may not be suitable for everyone. An informed decision, grounded in a thorough analysis and understanding of the market and one’s risk tolerance, is essential. Moreover, past performance should not be taken as a reliable indicator of future results.
Through this exposition, it is clear that the current market conditions for silver exemplify a fascinating interplay between time and price, underscored by the principles of Gann analysis and the Square of 9. As we navigate through these critical junctures, the market’s response to these established frameworks will be compelling to observe, elucidating further the intricate dynamics at play in commodity trading.


