


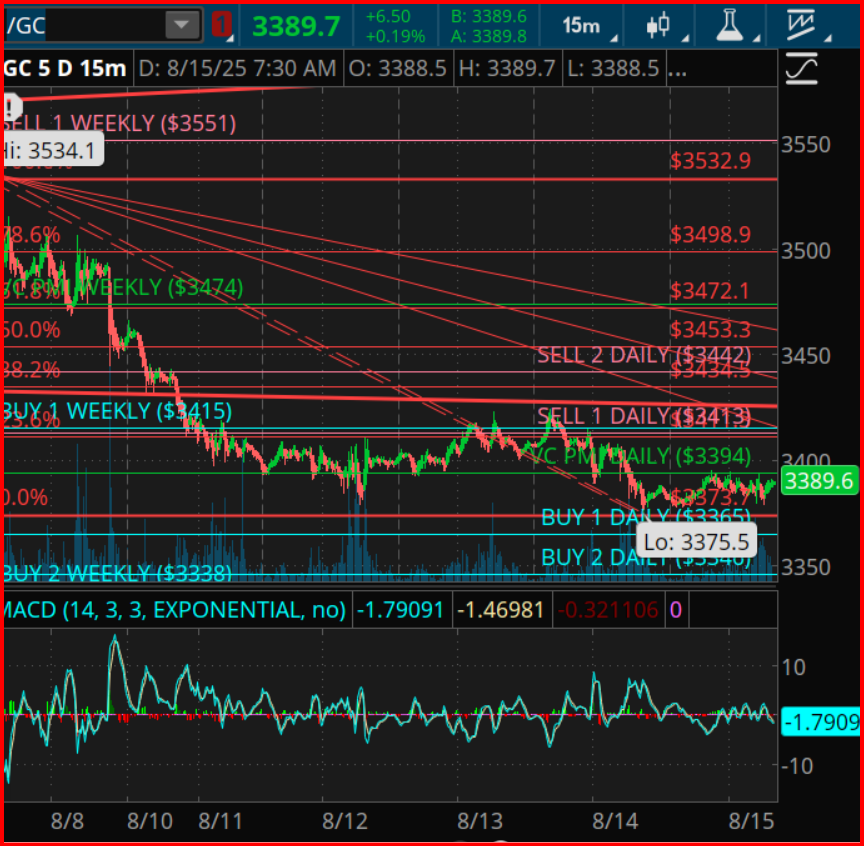
In the ever-evolving and intricate world of precious metals trading, gold has recently taken significant strides, with its current trading value marked at $3,389.7, marking an incremental rise of $6.50 or 0.19%. This movement comes as the market endeavours to find a new equilibrium following a remarkable peak on August 7, when gold reached $3,534.1. The recent price movements have found themselves nestled within a narrow corridor, bounded by the Daily Buy 1 level at $3,365 and closely approaching the VC PMI Mean at $3,394, with the Weekly Buy 2 threshold at $3,338 establishing a fundamental lower boundary. This compact price fluctuation pattern is indicative of a significant pivot point, a scenario where layers of near-term and mid-term support converge. Such conditions have, in historical contexts, often been a precursor to robust mean reversion tendencies.
The Foundation of VC PMI Alignment
The VC PMI (Volume Confirmation and Price Momentum Indicator) levels elucidate a comprehensive support landscape, intricately weaving together daily and weekly buy thresholds into a cohesive structure. Specifically, these levels span:
- Daily Buy 1 at $3,365.
- Daily Buy 2 at $3,340.
- Weekly Buy 1 at $3,415.
- Weekly Buy 2 at $3,338.
This amalgamation creates a multilayered equilibrium foundation. When the price of gold sustains itself above this meticulously defined zone amid compression, it significantly tilts the scale in favor of a bullish trajectory, potentially propelling the price towards the elevated daily pivot markers.
Encountering Resistance: The Fibonacci & Square of 9 Framework
The pursuit upwards faces a litmus test upon approaching the $3,394 benchmark (VC PMI Mean), beyond which the journey to persevere through resistance levels becomes more arduous. Key resistances lay in wait at $3,413 (Daily Sell 1), extending to a supply zone at $3,444.2 (Daily Sell 2) and $3,453.3 (representing the 38.2% Fibonacci retracement level). Further up the ladder, a denser resistance cluster forms at $3,472.1 (blending Weekly Sell 2 with the 61.8% Fibonacci level) and touches $3,474.9 (at the 78.6% Fibonacci threshold). The Square of 9 assessments identify $3,413 and $3,472 as critical “energy points” within this mathematical and geometric construct, zones likely to either halt the upward momentum or trigger price reversals.
Gann Time Cycles and Their Implications
From the perspective of Gann time cycles, notable inflection points emerge. The period post the August 7 climax sees a Gann 45° timing converge around August 13–14, coinciding neatly with this week’s subtle trough attempt. Moving ahead, the subsequent 90° phase lands on August 20–21, delineating a high-probability window for accelerated action. Extending our gaze towards the long-term, a 360-day Gann cycle pinpoints September 28, 2024, as a pivotal anchor date, cycling through four distinct 90° stages and culminating full circle on September 28, 2025. This extended timeline underscores periods of elevated market volatility and trend definition, influential in shaping the course for the year following the completion of this cycle.
Strategic Paths Ahead
Venturing into the near future, the battlefield presents two distinct pathways:
Bullish Scenario: Sustaining the gold price above the foundational supports of $3,365–$3,338 primes the market for anticipated rallies targeting the $3,413, $3,444, and further to $3,472–$3,475 thresholds as we progress into late August and possibly September.
Bearish Scenario: Conversely, a descent below the crucial $3,338 marker could precipitate a corrective slide towards the $3,300–$3,250 vicinity ahead of the critical September cycle date.
As we find ourselves ensconced within this pivotal juncture, a confluence of VC PMI levels, harmonic resonances, and imminent Gann time cycles coalesce to define a highly charged zone of action. With August 20–21 and September 28 earmarked as crucial dates, the incoming quarter promises to be a defining period in charting gold’s trajectory.
Disclaimer: It’s imperative to approach trading in derivatives, financial instruments, and precious metals with a keen awareness of the inherent risks involved. Past performance does not serve as a reliable indicator of future results, underlining the need for thorough analysis and strategic prudence in navigating these complex markets.


